Download
1 / 30
300 likes | 435 Views
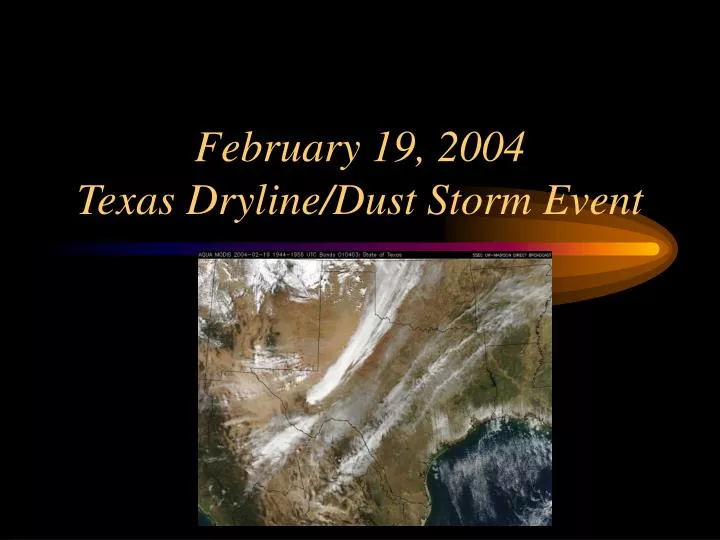
February 19, 2004 Texas Dryline/Dust Storm Event. On February 19, 2004, a strong upper level system moved across eastern New Mexico and western Texas, resulting in strong winds and intense blowing dust, as can be seen in this towercam picture from Lubbock, TX.

E N D
On February 19, 2004, a strong upper level system moved across eastern New Mexico and western Texas, resulting in strong winds and intense blowing dust, as can be seen in this towercam picture from Lubbock, TX.
The dust storm was so strong that the dust was easily detected by radar, as seen from these radar images from Lubbock, TX and Midland, TX Lubbock, TX radar at 20:24 UTC Midland, TX radar at 22:25 UTC
Surface Observations • As can be seen in the observed surface station reports at 2216 UTC, there was convergent flow across west-central Texas. • And there were numerous reports of dust and haze along the Texas/New Mexico border and into the Texas panhandle.
300 mb • At 300 mb, a 100-125 kts jet streak was centered over west-central Oklahoma and the eastern part of the Texas panhandle. • The right jet entrance region, which is associated with upward vertical motion, was located over west-central Texas.
500 mb • At 500 mb, a trough was located over Texas with its axis oriented in a slightly northwest-southeast tilt across western Texas. • Thus, a region of positive vorticity advection, which is associated with upward vertical motion, was located over west-central Texas. • The overall flow across Texas was mainly out of the west with a 80-100 kt jet maximum located over the vicinity of Jayton, TX.
500 mb Cold Advection • Cold advection at 500 mb, as seen by the west-southwesterly flow crossing the isotherms over New Mexico, helped to produce a more unstable atmosphere by creating a more dry adiabatic lapse rate at mid-levels.
700 mb • At 700 mb, the flow across western Texas was westerly with a jet maximum of 50-60 kts located from northeast Mexico up through southeast Oklahoma.
850 mb • At 850 mb, a low-level jet is located from north-central Texas up into Missouri. Although this flow is not completely out of the south, it is helping to advect some Gulf moisture across eastern Texas. • The reason why the flow is more parallel with the 300 mb flow instead of directed mainly ageostrophically is because the flow regime has shifted from isallobaric to inertial-advective at this time.
Surface • At the surface, a cyclone was centered over eastern Oklahoma and central Kansas. Due to the cyclone's location, the flow across western Texas was almost directly out of the west. • An anticyclone was located over central Florida, which provided southerly flow from the Gulf of Mexico into eastern Texas, thus increasing the low-level moisture in that region. • To the two different flow regimes across Texas resulted in a convergent zone over west-central Texas.
Cloud band lines up exactly with the surface convergence zone
Surface Dewpoint • Note the strong surface dewpoint gradient located across west-central Texas and down into eastern Mexico. • That gradient is the location of the dryline.
Dryline Formation • Drylines form as the elevated well-mixed layer descends down the eastern slope of the Rocky Mountains and moves over the warm, moist Gulf of Mexico air in the southern Plains. • The deep mixing within the mixed layer dries out the atmosphere, resulting in lower dewpoint values.
Dryline Formation (Cont'd.) • The deep mixing progresses eastward as the 700 to 500 mb westerly winds advect the elevated well-mixed layer over the southern plains. • Solar heating warms the surface stable layer over central Texas, which helps to erode any capping inversion, thus allowing the elevated well-mixed layer to mix down to the surface and dry out that region. • If the warm, moist, stable layer is too deep, the layer will never become warm enough for the elevated mixed-layer to mix down to the surface, thus causing the dryline to stall.
Topography and Mixed Layers • Due to the elevated terrain of the Rocky Mountains in New Mexico and western Texas, any mixed layers that form in those areas will become elevated if there is mid-level westerly flow to advect them over the southern plains.
Skew-T Cities Fort Worth, TX Santa Teresa, NM Midland, TX Corpus Christi, TX
Elevated Well-Mixed Layers • At 12Z on February 19, Santa Teresa, NM had a fairly well-mixed layer from 850 mb up to 250 mb. • Note the west-southwesterly flow between 800 mb and up. This wind helped to advect the mixed-layer over Texas.
Elevated Well-Mixed Layer • At 12Z on February 19, Midland, TX also have a deep well-mixed layer with west-southwesterly flow from 800 mb on up.
Low-Level Saturation & Capped Layer • Note the westerly flow between 700 to 500 mb which has advected the elevated well-mixed layer over the region, helping to produce a capping inversion. • The southeasterly flow out of the Gulf of Mexico increased the saturation at low-levels.
Low-Level Saturation& Capped Layer • As with the Fort Worth sounding, note the westerly flow between 700 to 500 mb which has advected the elevated well-mixed layer over the region, helping to produce a capping inversion. • The southeasterly flow out of the Gulf of Mexico increased the saturation at low-levels.
GPS & Wind Profiler Cities Granada, CO Tucumcari, NM Cleburne, TX Jayton, TX
Tucumcari, NM GPS Data • At 22Z on February 19, a downslope wind moved through Tucumcari, NM as can be seen in the rapid and simultaneous changes in pressure, temperature and relative humidity at that time.
Granada, CO GPS Data • As with the Tucumcari GPS data, Granada, CO shows similar signals of a downslope wind event. IPW Pressure Relative Humidity Temperature
Jayton, TX GPS Data Note how dry the air is in the IPW graph as there is only about 1.0 cm of precipitable water in the entire column over Jayton, TX.
Cleburne, TX Profiler • Note the 25-35 m/s low-levels winds between 09Z and 15Z. • These increased low-level winds are the result of upper level momentum being transported downward by the well-mixed layer.
Tucumcari, NM Profiler • Similar situation as the previous profiler...note the wind speed increase within the lower levels as the upper level momentum is transported downward within the turbulent mixing of the well-mixed layer.
Jayton, TX Profiler • Similar situation as the previous profiler...note the wind speed increase within the lower levels as the upper level momentum is transported downward within the turbulent mixing of the well-mixed layer.
Granada, CO Profiler • Although not as intensely or deeply as the previous profilers, the wind speed does increase within the lower levels as the upper level momentum is transported downward within the turbulent mixing of the well-mixed layer.
Dust Storm • Thus, it was due to the deep mixing and the very dry atmosphere that resulted in the intense dust storm over eastern New Mexico and western Texas on 19 February 2004.