Download
1 / 1
10 likes | 120 Views
Quantification of Transforming Growth Factor- β in Radiation-Induced Muscle Fibrosis: A Pilot Study Evander Britt, Daniel Bracey, MD, Jeffrey Willy, PhD, Ann Tallant , PhD, Patricia Gallagher, PhD, Thomas Smith, PhD, Cynthia Emory, MD

E N D
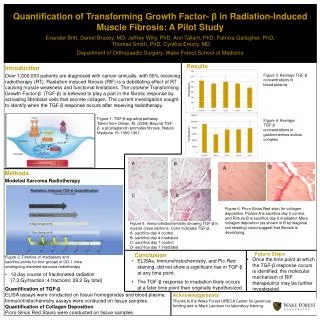
Quantification of Transforming Growth Factor- β in Radiation-Induced Muscle Fibrosis: A Pilot Study Evander Britt, Daniel Bracey, MD, Jeffrey Willy, PhD, Ann Tallant, PhD, Patricia Gallagher, PhD, Thomas Smith, PhD, Cynthia Emory, MD Department of Orthopaedic Surgery, Wake Forest School of Medicine Results Introduction Over 1,000,000 patients are diagnosed with cancer annually, with 50% receiving radiotherapy (RT). Radiation-induced fibrosis (RIF) is a debilitating effect of RT causing muscle weakness and functional limitations. The cytokine Transforming Growth Factor-β (TGF-β) is believed to play a part in the fibrotic response by activating fibroblast cells that secrete collagen. The current investigation sought to identify when the TGF-β response occurs after receiving radiotherapy. Figure 3. Average TGF-β concentrations in blood plasma Figure 1. TGF-β signaling pathway. Taken from Olman, M. (2009) Beyond TGF-β: a prostaglandin promotes fibrosis. Nature Medicine 15: 1360-1361. Figure 4. Average TGF-β concentrations in gastrocnemius-soleus complex A B Methods • Modeled Sarcoma Radiotherapy • Figure 2. Timeline of irradiations and • sacrifice points for four groups of CD-1 mice • undergoing modeled sarcoma radiotherapy • 10 day course of fractionated radiation • (7.3 Gy/fraction; 4 fractions; 29.2 Gy total) • Quantification of TGF-β • ELISA assays were conducted on tissue homogenates and blood plasma.Immunohistochemistry assays were conduced on tissue samples. • Quantification of Collagen Deposition • Picro-Sirius Red Stains were conducted on tissue samples. C D Figure 6. Picro-Sirius Red stain for collagen deposition. Picture A is sacrifice day 0 control, and Picture B is sacrifice day 0 irradiated. More collagen deposition (as shown in B by diagonal red shading) could suggest that fibrosis is developing. Figure 5. Immunohistochemistry showing TGF-β in muscle cross sections. Color indicates TGF-β. A- sacrifice day 4 control B- sacrifice day 4 irradiated C- sacrifice day 7 control D- sacrifice day 7 irradiated Future Steps Conclusion • Once the time point at which the TGF-β response occurs is identified, the molecular mechanism of RIF therapeutics may be further investigated. • ELISAs, Immunohistochemistry, and Pic-Red staining, did not show a significant rise in TGF-β at any time point. • The TGF-β response to irradiation likely occurs at a later time point than originally hypothesized. Acknowledgements Thanks to the Wake Forest URECA Center for generous funding and to Mark Landrum for laboratory training.