Download

1 / 55
610 likes | 1.62k Views
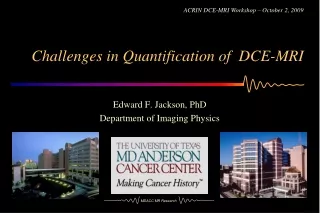
ACRIN DCE-MRI Workshop – October 2, 2009. Challenges in Quantification of DCE-MRI . Edward F. Jackson, PhD Department of Imaging Physics. Outline. General MR quantification challenges Lack of standards Varying measurement results between vendors Highly variable quality control procedures

E N D
ACRIN DCE-MRI Workshop – October 2, 2009 Challenges in Quantification of DCE-MRI Edward F. Jackson, PhD Department of Imaging Physics
Outline • General MR quantification challenges • Lack of standards • Varying measurement results between vendors • Highly variable quality control procedures • Varying measurement results between centers • DCE-MRI quantification challenges • Data acquisition • Data processing • Quality control • Vendor specific issues • Multicenter trial issues
General Challenges in MR Quantification Arbitrary (and spatially- / temporally-dependent) signal intensity units • Magnitude and homogeneity of Bo • Magnetic field gradient nonlinearity and/or miscalibration • RF coil dependency: RF coil type, B1 sensitivity profiles, subject positioning within the coil • Slice profile variations (with RF pulse shape, flip angle, etc.) • System stability issues (RF & gradient subsystems, Bo, RF coils, etc.)
Bo Homogeneity • In general: Larger B0 => higher signal-to-noise • B0inhomogeneity yields spatially variant signal intensities in general and spatially variant fat suppression when chemically selective saturation methods are utilized.
General Challenges in MR Quantification Arbitrary (and spatially- / temporally-dependent) signal intensity units • Magnitude and homogeneity of Bo • Magnetic field gradient nonlinearity and/or miscalibration • RF coil dependency: RF coil type, B1 sensitivity profiles, subject positioning within the coil • Slice profile variations (with RF pulse shape, flip angle, etc.) • System stability issues (RF & gradient subsystems, Bo, RF coils, etc.)
In-Plane Through-Plane Slice at isocenter Gradient Field Nonlinearity Effects Through-Plane Reference: Sumanaweera TS et al., Neurosurgery 35(4):696-703, 1994.
Gradient Field Nonlinearity Effects 20 cm FOV, white: w/correction, black: w/o correction Isocenter 20 cm off isocenter Errormax with correction: < 1 mm @ 10 cm Errormax w/o correction: ~ 4.5mm @ 10 cm Errormax with correction: < 2 mm @ 10 cm Errormax w/o correction: ~ 5.5cm @ 10 cm
Primary Limits on Spatial Accuracy • System Limitations • Poor Bo homogeneity • Linear scale factor errors in the gradient fields • Field distortion due to induced eddy currents • Nonlinearities of the gradient fields • Object-Induced • Chemical shift effects (fat / water displacement, in-plane and slice) • Intravoxel magnetic susceptibility differences (particularly air-tissue) • Effects are minimized with non-vendor specific appropriate acquisition parameters (increased BW, smaller FOV), but at the expense of SNR. [Importance of Technique!]
General Challenges in MR Quantification Arbitrary (and spatially- / temporally dependent) signal intensity units • Magnitude and homogeneity of Bo • Magnetic field gradient nonlinearity and/or miscalibration • RF coil dependency: RF coil type, B1 coil sensitivity profiles, subject positioning within the coil • Slice profile variations (with RF pulse shape, flip angle, etc.) • System stability issues (RF & gradient subsystems, Bo, RF coils, etc.)
B1 Coil Response Non-Uniformity B1 response non-uniformity 1.5T 3.0T
General Challenges in MR Quantification Arbitrary (and spatially- / temporally-dependent) signal intensity units • Magnitude and homogeneity of Bo • Magnetic field gradient nonlinearity and/or miscalibration • RF coil dependency: RF coil type, B1 sensitivity profiles, subject positioning within the coil • Slice profile variations (with RF pulse shape, flip angle, etc.) • System stability issues (RF & gradient subsystems, Bo, RF coils, etc.)
General Challenges in MR Quantification Slice profile variations (with RF pulse shape, flip angle, etc.) Typically, faster imaging sequences use increasingly truncated RF pulses resulting in thicker slice profiles for a given prescribed slice thickness. This gives rise to increased partial volume averaging effects and a concomitant loss of spatial resolution. Flip angle calibrations can also be negatively affected. 5 mm SE 5 mm fast GRE 5.07 mm 5.78 mm
General Challenges in MR Quantification Arbitrary (and spatially- / temporally-dependent) signal intensity units • Magnitude and homogeneity of Bo • Magnetic field gradient nonlinearity and/or miscalibration • RF coil dependency: RF coil type, B1 sensitivity profiles, subject positioning within the coil • Slice profile variations (with RF pulse shape, flip angle, etc.) • System stability issues (RF & gradient subsystems, Bo, RF coils, etc.)
General Challenges in MR Quantification System stability issues (RF & gradient subsystems, Bo, RF coils, etc.) • For quantitative imaging, particularly in longitudinal studies, a rigorous quality control program is critical. • Key components of frequent QC tests: • Geometric accuracy • Slice thickness • Signal-to-noise ratio (or low contrast object detectability) • Uniformity • High contrast spatial resolution • Center frequency • Transmit gain • Contrast response
ADNI • Multicenter, multivendor study • Optimized pulse sequence / acquisition parameters for each platform • MagPhan/ADNI phantom scan at each measurement point • Access to vendor gradient correction parameters • With full correction for gradient nonlinearities and optimized acquisition strategies, spatial accuracies of ~0.3 mm can be obtained over a ~180 mm spherical volume
Outline • General MR quantification challenges • Lack of standards • Varying measurement results between vendors • Highly variable quality control procedures • Varying measurement results between centers • DCE-MRI quantification challenges • Data acquisition • Data processing • Quality control • Vendor specific issues • Multicenter trial issues
Dynamic Contrast Enhanced-MRI 3.0 T 3D FSPGR 20 3.5-mm sections every 4.5 s 0.86-mm in-plane resolution Ktrans Parametric Map
Plasma Flow Endothelium 3 Ktrans CP(t) Plasma CP, vP EES CEES, ve 2 [GdDTPA] (mM) CL(t) 1 kep 0 0 2 4 6 8 10 Time (min) Measured Measured CL(t) = vPCP(t) + CEES(t) Two Compartment Pharmacokinetic Model CP = [Gd] in plasma (mM) = Cb / (1-Hct) CEES = [Gd] in extravascular, extracellular space (mM) Ktrans = endothelial transfer constant (min-1) kep = reflux rate (min-1) vP = fractional plasma volume, ve = fractional EES volume (= Ktrans / kep) Standardized parameters as proposed by Tofts et al., J Magn Reson Imaging, 10:223-232, 1999. MDACC MR Research
DCE-MRI Signal intensity data from tumor and vascular ROIs Determine vP, Ktrans, and kep, from non-linear Marquardt-Levenberg fitting of CL(t) and CP(t) data
Spin-Echo: TE/TR = 10/400 ms FSPGR: TR/TR = 2/10 ms, a=250 r1/r2 = 4.5 / 5.5 mM-1 s-1 T1,0 =1250 ms ; T2,0 = 125 ms FSPGR (S - S0)/ S0 (%) SE [GdDTPA] (mM) DCE-MRI – Pulse Sequences Several different pulse sequences and variations can be used • Most common: fast spoiled gradient echo, with or without magnetization preparation pulses
DCE-MRI Data Acquisition Challenges • Pulse sequence • Contrast response must be well characterized • Temporal resolution • Must match choice of pharmacokinetic model and parameters of interest • Must be rapid (~4-6 s) for generalized kinetic model with estimation of vp • Recommended to be ≤15 s for any pharmacokinetic model • Spatial resolution • Must be adequate for target lesion size and application • Anatomic coverage • Should fully cover target lesion(s) and include an appropriate vascular structure
DCE-MRI Data Acquisition Challenges • Effects of motion • Liver / lung / breast • Respiratory motion • Cardiac motion • Head & neck • Swallowing • Tongue / jaw movement • Brain and other “fixed” anatomy • Involuntary motion, e.g., when contrast agent is injected • Effects should be prospectively mitigated, if possible, or retrospectively addressed (rigid body or deformable registration)
DCE-MRI Data Acquisition Challenges • Vascular input function (VIF) • Needed to account for variations in cardiac output and contrast agent delivery parameters (i.v. access location, gauge of needle, position of arm, injection rate for contrast agent and flush, etc.) • Requires good temporal resolution • Acquisition strategy should: • Minimize motion artifacts due to pulsatile flow • Minimize the impact of flow related enhancement (in axial acquisition transverse to major vessel) on VIF, e.g., use in-plane reference vessel, spatial saturation pulse (at a cost of temporal resolution), etc.
DCE-MRI Data Acquisition Challenges • T1 measurement • Required if contrast agent concentration, as opposed to signal intensity change, is used in the pharmacokinetic modeling • Must be accomplished in a reasonable acquisition time • Options widely available on scanners: • Inversion recovery --- accurate, but too slow • Saturation recovery --- also slow • Variable flip angle fast gradient echo techniques --- can be acquired in acceptable scan times, but can yield widely varying T1 estimates depending on specific pulse sequence and acquisition parameters • T1 measurement “noise” is propagated into estimates of Ktrans and other pharmacokinetic model parameters.
VFA T1 Measurements 3D FSPGR TE=1ms, TR=5.1ms
DCE-MRI Data Acquisition Challenges • Quality Control • To reduce system-level variance in longitudinal measurements, a robust quality control program is needed • The ACR MR Accreditation Program is the most widely implemented MR QC program, but does not address all issues important in DCE-MRI, e.g., contrast response and signal stability. • Use of multiple “matched” scanners • “Upgrade Dilemma” • If a system is upgraded during an ongoing longitudinal study, a thorough evaluation of the impact(s) of such an upgrade on DCE-MRI sequences and acquisition parameters (and contrast response, signal stability, etc.) must be performed.
From Single- to Multi-Vendor Studies • Major challenges: • Protocol matching • Pulse sequence and acquisition parameter selection for matched: • contrast response • temporal resolution • spatial resolution • anatomic coverage • Can be achieved, but requires effort at start up and, subsequently, constant monitoring for changes in hardware/software (need for ongoing quality control) • Vendors focused on “competitive advantage” in diagnostic radiology, not on quantitative imaging applications
From Single- to Multi-Center Studies • Major challenges: • Matched protocols • Distribution and activation of protocols • Distribute/load electronically (ADNI) • Provide expert training and initial protocol load/test • Rely on local expertise • Compliance with protocol • Local radiologists, technologists • Widely varying quality control • Ranging from specific for DCE-MRI, to ACR MRAP, to none • “Scanner upgrade dilemma” • Data management / submission
DCE-MRI Data Analysis Challenges • Data analysis implementation strategies are as variable as acquisition strategies • Currently, DCE-MRI analysis tools based upon pharmacokinetic modeling are developed by the users as no such tools are currently commercially available from the MR vendors • Choice of model must match data acquisition strategy, e.g., temporal resolution of the acquired data • To facilitate testing/validation of various analysis packages, readily available, standardized test / retest data and analysis results (Ktrans, kep, ve, vp) are needed.
DCE-MRI Data Analysis Challenges • Many choices to be made: • Vascular input selection • Manual ROI, automated identification vascular structure pixels, etc. • Reproducibility • Lesion region of interest(s) • Definition criteria • Reproducibility • Fits of single averaged pixel uptake curve or pixel-by-pixel fits • Modeling of: D[Gd](t) (requiring T1 mapping) or DSI(t) data
Quantitative Imaging Biomarkers – Who’s Interested? NIST USMS Workshop 2006 Representative Agencies / Organizations
General As Yet Unmet Needs To move MR imaging biomarkers from exploratory / secondary endpoints to primary endpoints / surrogate markers: • There exists a need for standardized acquisition pulse sequences and analysis techniques for MR “imaging biomarker” studies. • Validated phantoms and test data need to be available to users in order to test new releases of pulse sequences and analysis software. • Specific phantoms should be available to validate each vendor’s acquisition techniques for the particular MR biomarker technique (lesion morphology, perfusion, diffusion, MR spectroscopy, etc.).
General As Yet Unmet Needs To move MR imaging biomarkers from exploratory / secondary endpoints to primary endpoints / surrogate markers: • Imaging biomarker to tissue-based and outcome measure comparisons are needed for validation. • Reproducibility (test/retest) studies are lacking in several key areas.
Need for Standardized Imaging Techniques Multi-center trial design = Variations in imaging Hardware & Software algorithms • Standardize imaging techniques across multi-centers • Cross-consistency - within & across imaging systems • Don’t assume – assess! • Discover & adjust for differences George Mills, MD, MBA (former Director FDA/CDER Division of Medical Imaging & Radiopharmaceutical Drug Products)
Need for Standardized Imaging Techniques • “Precision is the goal” • Implement the same, detailed imaging acquisition protocols at all clinical sites • Optimize image processing & reconstruction software • Avoid manual techniques as possible • Select & develop semi-automated => automated • Reduce human interactions • “Established” vs. “cutting edge” George Mills, MD, MBA (former Director FDA/CDER Division of Medical Imaging & Radiopharmaceutical Drug Products)
Quantitative MR Efforts • NCI: RIDER / SAIC Contracts • IRAT: MR Committee / Phantom Development • RSNA: Quantitative Imaging Biomarker Alliance DCE-MRI Cmte • ISMRM: Ad Hoc Committee for Standards for Quantitative MR • AAPM: Working Group for Standards for Quantitative MR Measures
NCI RIDER • NCI Cancer Imaging Program RIDER • Reference Image Database to Evaluate Response* Collaborative project for development and implementation of a caBIG public resource Series of manuscripts in Translational Oncology in Dec 2009 and data made publically available through NCIA (phantom and anonymized clinical trial imaging and meta data)
NCI RIDER Reports • Clarke L, Croft B, Nordstrom R, Zhang H, Kelloff G. Editorial: Quantitative imaging for evaluation of response to cancer therapy • Meyer CR, Armato III SG, Fenimore CP, McLennan G, Bidaut LM, Barboriak DP, Gavrielides MA, Jackson EF, McNitt-Gray MF, Kinahan PE, Petrick N, Zhao B. Quantitative imaging to assess tumor response to therapy: common themes of measurement, truth data and error sources • McNitt-Gray MF, Bidaut LM, Armato III SG, Meyer CR, Gavrielides MA, McLennan G, Petrick N, Zhao B, Reeves AP, Beichel R, Kim H-JG, Kinnard L. CT assessment of response to therapy: tumor volume change measurement, truth data and error • Kinahan PE, Doot RK, Wanner-Roybal M, Bidaut LM, Armato III SG, Meyer CR, McLennan G. PET/CT assessment of response to therapy: tumor change measurement, truth data and error • Jackson EF, Barboriak DP, Bidaut LM, Meyer CR. MR assessment of response to therapy: tumor change measurement, truth data and error sources
NCI RIDER DCE-MRI Phantom Data Gel-filled compartments with varying T1 relaxation times Eurospin TO5 – DiagnosticSonar, Ltd.
RIDER T1 Measurements – Vendor 1 Run 1 = baseline Run 2 = 2 hrs post baseline Week 1 = 1 week post baseline Bosca & Jackson, AAPM 2009; Jackson et al., Trans Oncol, Dec 2009
RIDER T1 Measurements – Vendor 2 Run 1 = baseline Run 2 = 2 hrs post baseline Week 1 = 1 week post baseline Bosca & Jackson, AAPM 2009; Jackson et al., Trans Oncol, Dec 2009
Imaging Response Assessment Teams • IRAT: MR Committee / Phantom Development • Current status: • MR phantom based on the commercially available MagPhan/ADNI phantom (The Phantom Laboratory). • Phantom distributed to IRAT MR sites to obtain multicenter, single vendor data. • Similar to, but pre-dates, RSNA QIBA DCE-MRI project acquisition and data analysis strategy
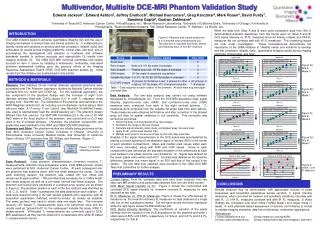
RSNA QI Biomarker Alliance • RSNA QIBA: DCE-MRI Technical Committee • Multiple subcommittees: • Phantom development/selection • Scan protocol / data analysis • Synthetic DCE-MRI test data • MR phantom based on the IRAT DCE-MRI phantom • Phantoms to be distributed to multiple MR sites to obtain multicenter (N=6), multivendor (N=3) data • Data analysis provided by core lab http://qibawiki.rsna.org/index.php?title=DCE-MRI
RSNA QI Biomarker Alliance Phantom Scans • Phantom and “cuboid” scanned using torso phased array coil to mimic typical Phase I clinical trial scans (liver mets / lung mets).
RSNA QI Biomarker Alliance • RSNA QIBA: DCE-MRI Technical Committee • Phantom measurements: • Phased array acquisition • Body coil acquisition • SNR acquisition • VFA T1 measurement acquisition • DCE acquisition • Each of the above acquisitions repeated with phantom rotated by 90, 180, 270, and 360o • All acquisitions repeated one week later Ratio map correction for B1 sensitivity characteristics
RSNA QIBA DCE-MRI Difference in T1 from each contrast sphere, week 1 minus week 0. Difference in R1 from each contrast sphere, week 1 minus week 0.
RSNA QIBA DCE-MRI Comparison of R1 vs Signal Intensity at Rotation “A”
ISMRM Ad Hoc Committee • ISMRM: Ad Hoc Committee for Standards for Quantitative MR • Membership includes MR physicists, technologists, radiologists, NIST representative, NCI/CIP representatives, vendors, pharma. Expertise in research trials using quantitative MR. • Current status: • White paper on quantitative MR • Design specifications & construction of a MR system phantom (collaboration with and funding by NIST) • Initial multicenter/multivendor phantom pilot studies to begin in late 2009 / early 2010. http://wiki.ismrm.org/twiki/bin/view/QuantitativeMR/