Download
1 / 18
180 likes | 310 Views
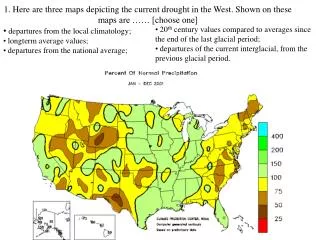
1. Here are three maps depicting the current drought in the West. Shown on these maps are …… [choose one] departures from the local climatology; longterm average values; departures from the national average; .

E N D
1. Here are three maps depicting the current drought in the West. Shown on these maps are …… [choose one] • departures from the local climatology; • longterm average values; • departures from the national average; • 20th century values compared to averages since the end of the last glacial period; • departures of the current interglacial, from the previous glacial period.
1. Here are three maps depicting the current drought in the West. Shown on these maps are …… [choose one] • departures from the local climatology; • longterm average values; • departures from the national average; • 20th century values compared to averages since the end of the last glacial period; • departures of the current interglacial, from the previous glacial period.
1. Here are three maps depicting the current drought in the West. Shown on these maps are …… [choose one] • departures from the local climatology; • longterm average values; • departures from the national average; • 20th century values compared to averages since the end of the last glacial period; • departures of the current interglacial, from the previous glacial period.
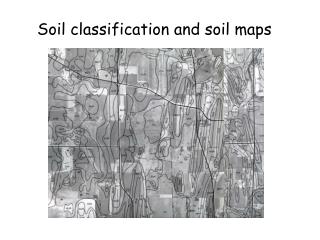
3. What is the name of this layer? earth surface
4.a Which of these two places has more water vapor in the air? b What do you base this observation on? Phoenix AZ near Fargo ND
R=H+ LE 5. Energy Balance at the Earth’s Surface, globally averaged: a. What is this term? b. R is the sum of two terms. What are these terms?
R=H+ LE 6. Energy Balance at the Earth’s Surface, globally averaged: What are the long-term-mean values of H and LE, expressed as a percentage of the top-of-the-atmosphere incoming solar radiation? a. LE = b. H =
8. How much is R, the global-mean net radiation at the Earth surface, in units of the Fig below?
9. Which three surface energy fluxes, of the five shown below, are larger than the global mean values, also shown below, in case of a dry desert surface at local noon?
11. This Fig suggests that at least a weak ozone hole has existed over Antarctica, uninterrupted at least since 1980. Is this true? Explain.
12. What does this Fig tell you about global climate change? Damage due to landfalling hurricanes along the Gulf and Atlantic coasts of the US.
13. (a) How would the Earth surface temperature change in response to a change like the one depicted below? (b) Explain. [hint: only consider the direct effect of the change shown below]
14a. At which of these two places is the daily temperature range largest?14b. Where is the annual temperature range largest?14c. Explain (hint: Eureka is along the northern California coast)
15. Explain the observed lag of maximum temperature after the local solar noon
16. Explain why the minimum temperature on calm, clear nights is lower in valleys than on adjacent hillsides.