Download
1 / 7
70 likes | 202 Views
This chapter focuses on how to describe data distributions using key statistical measures. It explains the importance of finding the center, particularly the median, and discusses its sensitivity to outliers. In addition, it outlines the concept of spread, detailing the range, interquartile range (IQR), and quartiles. The five-number summary is introduced for a comprehensive view of the data, alongside visual representations like boxplots. The chapter also contrasts the mean and median, emphasizing when to use each based on data symmetry and outliers.

E N D
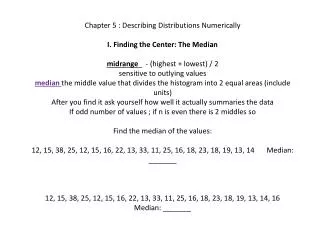
Chapter 5 : Describing Distributions Numerically I. Finding the Center: The Medianmidrange_ - (highest + lowest) / 2 sensitive to outlying valuesmedian the middle value that divides the histogram into 2 equal areas (include units)After you find it ask yourself how well it actually summaries the dataIf odd number of values ; if n is even there is 2 middles so Find the median of the values:12, 15, 38, 25, 12, 15, 16, 22, 13, 33, 11, 25, 16, 18, 23, 18, 19, 13, 14 Median: _______12, 15, 38, 25, 12, 15, 16, 22, 13, 33, 11, 25, 16, 18, 23, 18, 19, 13, 14, 16 Median: _______
Spread: Home on the Range • The more the data vary, the less the median alone can tell us. So, you should always report a measure of spread. • Range: max – min (single number, not an interval, also sensitive to outliers) • Spread: The Interquartile Range • Concentrate on the middle . (ignore extremes) • Quartiles – divides data into 4 equal parts Lower Quartile (Q1) Median (Q2) Upper Quartile (Q3) • Interquartile Range(IQR): Upper Quartile – Lower Quartile • Textbook includes median in each half, graphing calculator does not) • Lower Quartile 25th percentile); Upper Quartile (75thpercentile)
5 Number Summary • Reports a distributions median, quartiles, and extremes (min, Q1, median, Q3, max) • Making Boxplots • Box plot– displays the 5 number summary as a central box with whiskers that extend to the non-outlying data values • Particularly effective for comparing distributions. • Fences - used to identify outliers • (help with construction, but never include in your boxplot) • If a data value falls outside one of the fences, we do not connect it with whiskers • Lower Fence: Q1 – 1.5IQR • Upper Fence: Q3+ 1.5IQR
Mean or Median? • Mean cuts the data into 2 halves not taking into account their size • Median takes their size into account (the point at which the histogram would balance) • Left Skewed → mean to the left of the median • Right Skewed → mean to the right of the median • If data is skewed better to use themedian_.
What about the Spread? The Standard Deviation • IQR is good but ignores individual data • Standard deviation– takes into account how far each value is from the mean • Only appropriate for symmetric data • Deviation– distance a value is from the mean • Could average them but the + and – would cancel each other out, so we square them • Standard Deviation_ – the average (almost) of the deviations
Shape, Center, and Spread • So… • Skewed →IQR & MEDIAN • Symmetric → MEAN & STANDARD DEVIATION • Outliers → median / IQR_ OR Mean / standard deviation without outliers • Read page 87 (What Can Go Wrong) and 88- 89 (Terms)