Download
1 / 48
480 likes | 511 Views
Raman Spectroscopy Probe With In Vivo Applications. Stephen Esposito (CpE) Michael Gonzalez (EE) Chelsea Greene (EE) Megan Melvin (PSE) Group 8 CREOL. Live Action Safe Examination Raman Spectroscopy - L.A.S.E.R.S. Advising from Dr. Kyu Young Han

E N D
Raman Spectroscopy Probe With In Vivo Applications Stephen Esposito (CpE) Michael Gonzalez (EE) Chelsea Greene (EE) Megan Melvin (PSE) Group 8 CREOL
Live Action Safe Examination Raman Spectroscopy - L.A.S.E.R.S. Advising from Dr. Kyu Young Han & Dr. Peter J. DelfyettSponsored by Ocean Optics
Motivation Cancer is the 2nd leading cause of death in the U.S. Skin cancer is the most common type of cancer Skin biopsies: Invasive, painful, costly Results may take several days Pathologist visually inspects biopsy Why not use light to analytically examine skin?
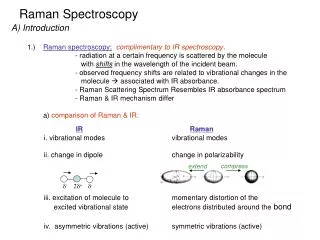
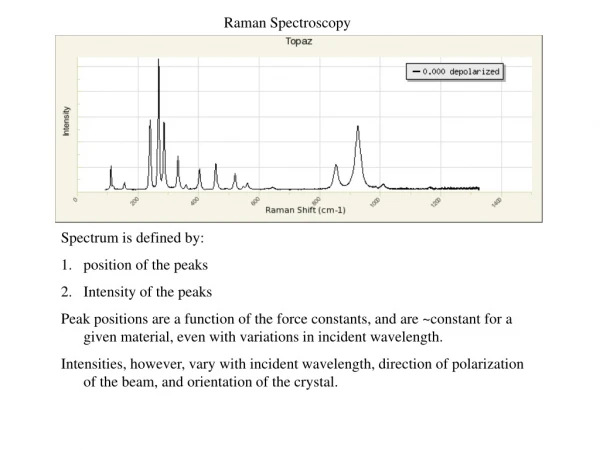
Goals and Objectives Use Raman spectroscopy to identify two separate, yet seemingly similar objects The Raman probe can identify the different gemstones diamond, Asha simulant diamond, and a purple gem Diamond and Asha share a spectral peak at 1333 cm-1 Asha has additional peaks at 1438 cm-1 and 1533 cm-1 Test Results
Block Diagram Data Power Flow
Electronic Elements Power to Raspberry Pi, laser, fan Temperature sensor Power to Raspberry Pi indicator LED Power to laser indicator LED Power switch Camera (in probe) LED beam (in probe)
Laser 1 m Fiber High-Power > 350 mW Spectrum-Stabilized Near-infrared 785 nm excitation wavelength Class IIIb (Class I if enclosed) Delivers laser light to probe via optical fiber 6.4 cm 7.6 cm
Spectrometer 8.91 cm Ocean Optics USB2000+ High resolution, high SNR Raman signal from probe is delivered to spectrometer via optical fiber 6.33 cm 1 m Fiber
Comparison of Spectrometers There are spectrometers more suited for Raman spectroscopy. USB2000+ was donated by our sponsor.
Raspberry Pi 3 85 mm Important Specifications: 1.2GHz quad-core ARMv8 Processor 1GB Ram 40 GPIO Pins 4 USB Ports HDMI Port 56 mm
Heat Concerns: Main Body System Instability- Laser and Microcontroller User safety Addressed with: • Temperature Sensor (Dallas DS18B20) • Heat Sinks on TO-220 components • Fan
Probe Internals The optical components are mounted onto a 3D printed custom mount. The camera module is placed in a position that captures an image of the sample being scanned. An LED underneath the camera mount helps to illuminate the sample. The PCB for the LED is sitting below the optical mount.
Probe Encasing • Window shown is where the sample is placed • Top-down view, showing the arrow indicating placement of sample • Front view where the focused laser beam exits • Back view, showing openings for
Camera 25 mm Allows for imaging and visibility of sample High resolution, small, effective with changes in light Allow real-time video feedback of sample Allow for photographing the tested sample Easy to interface with microcontroller Adjustable focal length 24 mm 16 mm
Optics 19.05 mm 12.7 mm Optical fibers for NIR transmission AR coated plano-CX lenses for collimation and focusing Beamsplitter to decrease incident power, redirect Raman signal Mirror Longpass filter to diminish Rayleigh signal (785 nm), allow transmission of Raman signal ( > 800 nm) Longpass Filter Mirror 6.35 mm 25.4 mm (1“) Lens Beamsplitter
Comparison of Beamsplitters The dichroic beamsplitter was purchased because the 50/50 beamsplitter available reduced the power and Raman signal too much.
Comparison of Mirrors The chosen mirror was available in the CREOL Senior Design lab and met the desired functionality.
Comparison of Filters A notch filter is not needed because only larger wavelengths (Stoke’s Raman shift) are of interest for this application.
Mounting the Optics Within the Probe Optics within the probe must be well-aligned and sturdy. Custom CAD ensures proper alignment and allows for custom-sized optical holders. 3D print is inexpensive, compact, and lightweight.
System Control Raspberry Pi -Controls Camera/Temperature sensor functionality -Java Capable to eventually run full system program External Computer -System Capable of Running Omnidriver Java API -x86 Based Processor for compatibility w/ OmniDriver -Controls Spectrometer/Data Analysis functions
Data Collection • Laser Spectrum Analysis ( 100 Pass Average) • Dark Spectrum Analysis (100 Pass Average) • Laser Spectrum - Dark Spectrum • Remove Nonlinearity • Apply Smoothing • Return Results Laser Spectrum Analysis- Use Laser/Spectrometer System to Analyze Skin Sample Run 100 Times to reduce impact of outlier results ~30s Runtime Dark Spectrum Analysis- Use Spectrometer to analyze raman signal without laser input Run 20 Times to reduce impact of outlier results ~5s Runtime Ensemble Average Smoothing- Run over all 100 data passes Reduces SNR by factor of 10-fold on 100 pases
Raman Analysis -Raman Spectra is analyzed for local maxima -These critical points are used to identify known compounds -Algorithm-based determination of which compounds have been tested Peaks at 1332, 1438, 1533 wavenumbers Peaks at 1381 wavenumbers
User Interface Visual representation of the project to end-users Specifications: Intuitive Professional Minimalistic
Safety Personal Protective Equipment (PPE): Laser safety glasses (for testing) Engineering controls: Protective housing Laser activation warning Output power controlled Administrative & Procedural controls: Proper labelling Product user manual
Future Improvements Use non-linear voltage regulators Omni Driver compatibility with ARM-based processors to allow for 1-system functionality Add a crosshair to the camera feed to indicate where the laser is focused Redesign probe for smaller size, and more intuitive targeting Redesign main casing
Future Application Use Raman spectroscopy to identify different types of cancerous skin cells Can examine the amide protein bands Can be performed in vivo Benefits of Raman: • Non-invasive • Non-destructive • Fast results Average normalized spectra of normal skin, basal cell carcinoma, and melanoma, showing differences in relative intensities and peak wavelengths. [DOI: 10.1117/1.JBO.17.7.077003]