Retrieving Cirrus Optical Thickness from MODIS Reflectance Data for Climate Studies
10 likes | 123 Views
This study focuses on the retrieval of optical thickness and microphysical properties of tropical and midlatitude cirrus clouds using MODIS reflectance data. The unique band at 1.375 µm from the MODIS instruments on TERRA and AQUA satellites allows for an unprecedented understanding of the role of thin cirrus clouds in the Earth's climate system. New methodologies have been developed for effective retrieval of these properties, contributing to future climatology efforts and enhancing our understanding of radiative forcing in climate models.

Retrieving Cirrus Optical Thickness from MODIS Reflectance Data for Climate Studies
E N D
Presentation Transcript
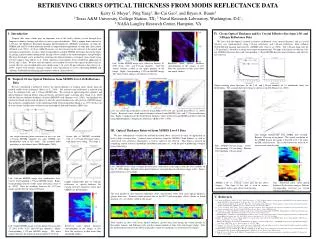
RETRIEVING CIRRUS OPTICAL THICKNESS FROM MODIS REFLECTANCE DATA Kerry G. Meyer1, Ping Yang1, Bo-Cai Gao2, and Bryan A. Baum3 1 Texas A&M University, College Station, TX; 2 Naval Research Laboratory, Washington, D.C.; 3 NASA Langley Research Center, Hampton, VA Tropical thin cirrus clouds play an important role in the earth's climate system through their longwave radiative forcing and effect on water vapor distribution. With a unique band centered at 1.375-µm, the Moderate Resolution Imaging Spectroradiometer (MODIS) instruments on both the TERRA and AQUA satellite platforms provide an unprecedented opportunity to study thin cirrus clouds (Platnick et al., 2003). At Texas A&M University, we have focused on the retrieval of the optical and microphysical properties of cirrus clouds using publicly available MODIS reflectance data in the hopes of gaining a greater understanding of the forcing of these clouds in the earth-atmosphere energy budget. We have developed a new method for retrieving the optical thickness of tropical cirrus clouds using level-1b radiance data (Meyer et al., 2004), which has subsequently been extended for application to level-2 and -3 data. We have also developed a new method to retrieve the optical thickness and ice crystal effective size of midlatitude cirrus clouds using 1.38- and 1.88-m reflectance data (Gao et al., 2004). Future work includes creating a tropical cirrus climatology, as well as collocating MODIS and Airborne Visible/Infrared Imaging Spectrometer data for cirrus retrieval. I. Introduction IV. Cirrus Optical Thickness and Ice Crystal Effective Size from 1.38- and 1.88-m Reflectance Data We have also developed a method to retrieve midlatitude cirrus optical thickness and ice crystal effective size simultaneously using 1.38-m reflectance and 1.88-m reflectance from Airborne Visible/Infrared Imaging Spectrometer (AVIRIS) data (Gao et al., 2004). The 1.88-m band, like the 1.38-m band, is located in a strong water vapor absorption band. We hope in the future to collocate 1.88-m AVIRIS reflectance data with corresponding 1.38-m MODIS data for optical thickness and effective size retrieval. Left: Visible MODIS image over Africa on January 30, 2003 (0.66-, 0.55-, and 0.47-m channels). Note the surface features evident in the upper portions of the image. Right: Corresponding 1.375-m MODIS image. The white outline indicates the region of retrieval. Retrieved cirrus optical thickness corresponding to the images at left. Note the sensitivity to thin cirrus (blue and purple shades). II. Tropical Cirrus Optical Thickness from MODIS Level-1b Reflectance Data Single-scattering phase functions for the 1.38- and 1.88-µm channels for 21 midlatitude cirrus size distributions. The assumed habit percentage is shown at top left (Baum et al., 2000). We have introduced a method to retrieve the optical thickness of tropical cirrus clouds using the isolated visible cirrus reflectance (Meyer et al., 2004). The isolated cirrus reflectance is inferred from level 1b calibrated 0.66- and 1.375-m MODIS data. We created an optical properties database and optical thickness look-up library using previously calculated single scattering data (Yang et al., 2000) with the Discrete Ordinates Radiative Transfer (DISORT) code (Stamnes et al., 1988). An algorithm was constructed based on this look-up library to infer the optical thickness for each pixel in a MODIS image. This method is complimentary to the operational cloud retrieval algorithm (King et al., 1997) for the case of cirrus clouds, and has been validated using Atmospheric Infrared Sounder (AIRS) data. Left: Ice cloud optical thickness retrieved using AIRS 1070-1135 cm–1 spectral data (Wei et al., 2004). Center: Retrieved cirrus cloud optical thickness inferred from MODIS 0.66- and 1.375-µm reflectance data. Right: Comparison of the cloud optical thickness values retrieved using MODIS and those retrieved using AIRS Brightness Temperature Difference (BTD) [900 - 1559]. III. Optical Thickness Retrieval from MODIS Level-3 Data Top: Sample lookup-table with AVIRIS data overlaid. Bottom: Close-up of top panel. The spatial resolution of the AVIRIS data in this image is lowered to 76 64 using the IDL rebin function. This is done before the retrieval to remove noise from the data. The single-scattering phase functions for the 0.66- and 1.375-m MODIS channels for nine CEPEX size distributions used in this study. The assumed habit percentage is also shown above (McFarquhar, 2000). Scatter plot of DISORT calculated 0.66- vs. 1.375-m reflectance values, with linear curve fitting. The slope is indicated at the top. We have subsequently extended the method described above (for level-1b data) for application to level-3 daily averaged data. Isolated cirrus reflectance from the MODIS Cloud Product, as well as solar/sensor view geometry information, is used as input for the retrieval. This effort is focused on computing various statistics (probability distribution functions, etc.) with the goal of producing a tropical cirrus climatology. Top: AVIRIS 0.66-m image. Center: Corresponding 1.38-m image. Bottom: Corresponding 1.88-m image. Left: MODIS level-3 daily averaged derived cirrus reflectance in the tropics from the Terra satellite on July 27, 2002. Right: Inferred cirrus optical thickness corresponding to reflectance image at left. Data is plotted between 30º latitude. Left: 0.66-m MODIS image over southeastern Asia. Center: Corresponding 1.375-m MODIS image. Right: Corresponding derived visible cirrus reflectance (Gao et al., 2002). Note the similarity between the 1.375-m image and the derived cirrus reflectance. Sample lookup-table plot of 0.66-m reflectance vs. optical thickness for varying effective diameters (from nine CEPEX size distributions). AVIRIS 1.38- vs. 1.24-m scatter plot for the above images. The slope of this plot is used to remove atmospheric water vapor effects from the data. Top: Retrieved cirrus cloud optical thickness for the above images. Bottom: Corresponding retrieved ice crystal effective diameter (m). The total number of days between September, 2001, and October, 2002, with cirrus optical thickness greater than zero. Persistent cloud patterns due to the ITCZ and orographic effects (Andes in South America, etc.) are clearly visible in this image. B. A. Baum, D. P. Kratz, P. Yang, S. C. Ou, Y. Hu, P. F. Soulen, S. –C. Tsay, “Remote sensing of cloud properties using MODIS airborne simulator imagery during SUCCESS 1. Data and models,” J. Geophy. Res., 105, 11767-11780, 2000. B. –C. Gao, P. Yang, W. Han, R.-R. Li, and W. J. Wiscombe, “An algorithm using visible and 1.375-m channels to retrieve cirrus cloud reflectances from aircraft and satellite data,” IEEE Trans. Geosci. Remote Sensing, 40, 1659-1688, 2002. B. –C. Gao, K. Meyer, and P. Yang, “A new concept on remote sensing of cirrus optical depth and effective ice particle size using strong water vapor absorption channels near 1.38 and 1.88 m,” IEEE Trans. Geosci. Remote Sensing, 2004 (in press). M. D. King, S. –C. Tsay, S. E. Platnick, M. Wang, and K. N. Liou, “Cloud retrieval algorithms for MODIS: Optical thickness, effective particle radius and thermodynamic phase,” MODIS Algorithm Theoretical Basis Document, NASA, 1997. G. M. McFarquhar, “Comments on ‘Parameterization of effective sizes of cirrus-cloud particles and its verification against observations’ by Zhian Sunand Lawrie Rikus (October B, 1999, 125, 3037-3055),” Quart. J. Roy. Meteor. Soc., 126, 261-266, 2000. K. Meyer, P. Yang, and B.-C. Gao, “Optical thickness of tropical cirrus clouds derived from the MODIS 0.66- and 1.375-m channels,” IEEE Transa. Geosci. Remote Sens., 42, 833-841, 2004. S. Platnick, M. D. King, S. A. Ackerman, W. P. Menzel, B. A. Baum, J. C. Riedi, and R. A. Frey, “The MODIS cloud products: algorithms and examples from Terra,” IEEE Trans. Geosci. Remote Sensing, 41, 459-473, 2003. K. Stamnes, S.-C. Tsay, W. Wiscombe, and K. Jayaweera, “Numerically stable algorithm for discrete-ordinate-method radiative transfer in multiple scattering and emitting layered media,” Appl. Opt., 27, 2502-2509, 1988. H. Wei, P. Yang, J. Li, B. A. Baum, H. -L. Huang, S. Platnick, Y. X. Hu, and L. Strow, “Retrieval of semi-transparent ice cloud optical thickness from Atmospheric Infrared Sounder (AIRS) measurements,” IEEE Trans. Geosci. Remote Sens., 2004 (in press). P. Yang, K. N. Liou, K. Wyser, and D. Mitchell, “Parameterization of the scattering and absorption properties of individual ice crystals,” J. Geophy. Res., 105, 4699-4718, 2000. V. References Total number of days with cirrus optical thickness greater than zero during the winter months of December, January, and February (left), and the summer months of June, July, and August (right). Note the northward movement of the ITCZ (especially evident over land masses) from winter to summer. Left: Visible MODIS image over the Indian Ocean on July 13, 2002 (0.66-, 0.55-, and 0.47-m channels). Right: Corresponding 1.375-m MODIS image. The white outline indicates the region of optical thickness retrieval. Retrieved cirrus optical thickness corresponding to the images at left. Note the sensitivity to thin cirrus (blue and purple shades).