Download

1 / 17
170 likes | 400 Views
Corn Genetics & Chi- Square Goodness of Fit Test. Pedigrees and probability analysis to follow. Outline. Highlight some key points in syllabus Corn color and collection of data (phenotypes) Chi-Square Analysis. Corn genetics Lab. Application of Chi-Square Analysis.

E N D
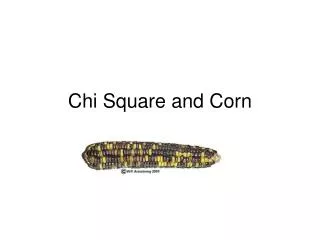
Corn Genetics &Chi- Square Goodness of Fit Test Pedigrees and probability analysis to follow.
Outline • Highlight some key points in syllabus • Corn color and collection of data (phenotypes) • Chi-Square Analysis
Application of Chi-Square Analysis • The color pattern in corn is due to multiple genes • Are variations in number of observed phenotypes due to chance alone?
Objective • Complete corn worksheet • Set up Punnett Squares using the genotypes given • Compare expected data to observed data • Perform Chi Square Analysis
Corn Kernel Color • Color of aleurone masks endosperm color • Only with colorless aleurone can endosperm color be determined • Determined by several genes • Refer to genotypes in lab manual!
Gene interaction can occur:Epistasis is a form of gene interaction in which one gene masks the phenotypic expression of another.
Today there are: 3 crosses of corn F1 X F1 Multiple alleles are tested for expression in F2 generation
Note color differences • Cross C • Cross D (darker color is purple) • Cross F (call purple, may look red!)
F1 phenotype F1 X F1 genotypes Yellow YYC’Rr X YYC’Rr Cross C
F1 phenotype F1 X F1 genotypes Purple yyPpRr X yyPpRr Cross D
F1 phenotype F1 X F1 genotypes Purple yyCcRr X yyCcRr Cross F
Chi Square Statistical “Goodness of Fit Test” • Why do we use it? • . • To find out determine if probability are due to chance alone. An example of how to calculate a Chi Square
Genetic information regarding the corn color patterns are provided in your lab manual. CORN WORKSHEET IS DUE 3/5