Download
1 / 10
100 likes | 284 Views
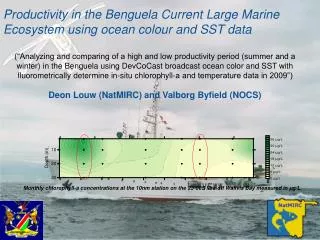
Monthly chlorophyll-a concentrations at the 10nm station on the 23º00S line off Wallvis Bay measured in µg/L. Productivity in the Benguela Current Large Marine Ecosystem using ocean colour and SST data

E N D
Monthly chlorophyll-a concentrations at the 10nm station on the 23º00S line off Wallvis Bay measured in µg/L. Productivity in the Benguela Current Large Marine Ecosystem using ocean colour and SST data (“Analyzing and comparing of a high and low productivity period (summer and a winter) in the Benguela using DevCoCast broadcast ocean color and SST with fluorometrically determine in-situ chlorophyll-a and temperature data in 2009”) Deon Louw (NatMIRC) and Valborg Byfield (NOCS)
Objectives • Compare the in-situ data with RS data • Creating a weekly composite • Time series analysis ILWIS
Remote sensing In-situ Pre conditions Pre-screen of Data Chl-a Chl-a Chl-a Kd490 Temperature Chlorophyll-a Chlorophyll-a Temperature Data cleanup Algorithm to mask suspect pixels Meta-data Step 1: Import mage Step 2 :Stations Step 3 : Extract Data Step 4: Statistical analysis Time match-up Scatter plot Excel sheet Match up Temperature Chl Kd490 Flow Chart
(A) Comparison of the RS data with the in-situ data (1km) Step 1 Import image using the GEONETCast ToolBox
(A) Create a Domain (B) Create a Table (C) Create a Point Map Map_Stations Map_Border Map_Raw Map_2 Map_1 Map_3 Step 2Define your sampling point/s by creating a Point Map
Step 3Extract data (A) Reading of actual values from the image (B) By creating a Table with the remote sensing data of interest in it (C) By creating a Table using Map List
Remote Sensing Data In-situ Data Scatter plots Scatter plots Step 4Comparative analysis of the match-ups