GUI For A Virtual Pipeline Simulation Testbed
This presentation covers the development and implementation of a user-friendly GUI for a virtual pipeline simulation testbed. Highlighting the enhancements from previous work, the GUI is built using Java Swing and JGraph, allowing users to create and manipulate virtual pipeline systems with features like drag-and-drop, result visualization, and database connectivity. Feedback from users indicates high satisfaction with the interface's functionality and ease of use. The session includes a demo showcasing the GUI in action and a discussion of new component requirements for improved simulation capabilities.

GUI For A Virtual Pipeline Simulation Testbed
E N D
Presentation Transcript
GUI For A Virtual Pipeline Simulation Testbed By, Revathi Manni Ranganathan Major Professor: Dr.Virgil Wallentine
Agenda • Pipeline Editor – Introduction • Previous Work by Oyenan • New Requirements • Design and implementation • User Feedback • Demo
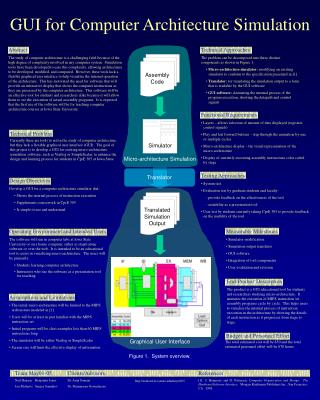
Pipeline Editor- An introduction • Tool to create and manipulate virtual pipeline systems. • Window to the Simulators • Cut, Copy, Paste, drag and drop • Store / Retrieve pipeline system in .vps format • Visualize the results
Pipeline Editor • Developed using Java Swing, JGraph, Oracle 8i • Can be started on a remote machine • Requirements – Java Web Start, Web browser, JDBC driver • Connects to the Simulator on the remote server
JGraph • Graph drawing component purely in Java Swing • Based on Model-View-Controller framework • Graph Theory + Swing Architecture = JGraph • Provides cut, copy, paste, drag & drop, zoom
Earlier Work by Oyenan • Basic Version of the GUI • Editor built on top of JGraph • Modeling of pipeline components – pipes, compressors • Job Control Optimizer • Result Visualization
New Requirements • Connector – generic type • Modification of Pipe • Compression Units • Connection to the Parallel Simulator • Connection to the Sequential Simulator
Connector • Generic Type Component • Multiple incoming and outgoing branches • Number decided by the user at run time • Replaces 2-way & 3-way Split, 2-way & 3way Combine
Pipes • Should support visualization of the leftmost and rightmost nodes • Implemented by class MyEdge – extension of JGraph’s Edge • Required modification in DataCell
Compression Units • Generic Type Component • Comprises of a Driver and Compressor • Four Basic types – • Reciprocating Engine – Reciprocating Compressor • Gas Turbine – Centrifugal Compressor • Reciprocating Engine – Centrifugal Compressor • Gas Turbine – Reciprocating Compressor
Compression Unit - Design • Different models under each type • Properties can be grouped meaningfully – Simulation Data, Operational Data, Manufacturer’s Data • Type and model name can be chosen at run time. • New models can be created and stored in the database
Adaptations • Customized UserObject for each component • Customized method to draw property panel • Provision to group properties meaningfully
GUI- Parallel Simulator • Connection is through sockets • Two separate threads are used to avoid GUI freezing • SimulatorClient – send user commands • SimulatorDataClient – get data and status
GUI-Sequential Simulator • Communication is through text files in ASCII format • Input text file contains graph data • Output text file contains simulation data • Option to set global parameters available for input text file.
GUI-Sequential Simulator • GraphParser – Input text file generator • Covert .vps to .txt
Sequential Simulator - GUI • The Sequential Simulator generates output in standard text format. • The text file is parsed by the GUI to create a live simulation effect • Simulation is the same as replay
GUI to Simulators - Supported Features • Simulate (Only in Parallel version) • Replay • Stop • Pause / Resume • Step / Skip Forward • Step / Skip Backward
User Feedback • “The GUI application fully implements these features and let users construct a natural gas pipeline system via drag-and-drop. The interface is very friendly. It can send requests to the server (simulator) and display the results back from the server in real-time. In the future, more components may be supported. The display of the results may be improved. In a word, the GUI is excellent.” - Liubo Chen, Programmer – Parallel Simulator • “The GUI for the VPST is a very useful tool for the user to create any pipeline network and run the simulation process. The GUI in its present form contains all the basic components that a Pipeline network comprises off. - Ravi Kiran Addanki, Programmer – Sequential Simulator
Conclusion • The new requirements have been satisfied • The basic software has been adapted to meet the complex demands • The tool is fully functional with minimum system requirements
References • www.jgraph.org • Oyenan Wallemitien’s documentation on the Pipeline Editor • www.java.sun.com
Acknowledgements • Dr. Virg Wallentine • Dr. Dan Andresen • Dr. Prakash Krishnaswamy