Neutral mutations
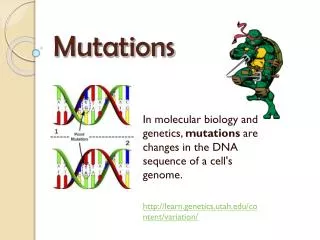
Neutral mutations. Neither advantageous nor disadvantageous Invisible to selection (no selection) Frequency subject to ‘drift’ in the population Mutation rate = Substitution rate (independent of population size)

Neutral mutations
E N D
Presentation Transcript
Neutral mutations • Neither advantageous nor disadvantageous • Invisible to selection (no selection) • Frequency subject to ‘drift’ in the population • Mutation rate = Substitution rate (independent of population size) • In small populations, slightly deleterious or advantagous mutations behave as if neutral. (Neff*s<<1)
Degeneracy of 1st vs 2nd vs 3rd position sites results in 25.5% synonymous changes and 74.5% non synonymous changes (Yang&Nielsen,1998). Genetic Code
Measuring Selection on Genes • Null hypothesis = neutral evolution • Under neutral evolution, synonymous changes should accumulate at a rate equal to mutation rate • Under neutral evolution, amino acid substitutions should also accumulate at a rate equal to the mutation rate From: mentor.lscf.ucsb.edu/course/spring/eemb102/lecture/Lecture7.ppt
Testing for selection using dN/dS ratio dN/dS ratio (aka Ka/Ks or ω(omega) ratio) where dN = number of non-synonymous substitutions / number of possible non-synonymous substitutions dS =number of synonymous substitutions / number of possible non-synonymous substitutions dN/dS >1 positive, Darwinian selection dN/dS =1 neutral evolution dN/dS <1 negative, purifying selection
dambe • Three programs worked well for me to align nucleotide sequences based on the amino acid alignment, • One is DAMBE (works well for windows). This is a handy program for a lot of things, including reading a lot of different formats, calculating phylogenies, it even runs codeml (from PAML) for you. • The procedure is not straight forward, but is well described on the help pages. After installing DAMBE go to HELP -> general HELP -> sequences -> align nucleotide sequences based on …-> • If you follow the instructions to the letter, it works fine. • DAMBE also calculates Ka and Ks distances from codon based aligned sequences. • Alternatives are • tranalign from the EMBOSS package, and • Seaview (see below)
Codon based alignments in Seaview Load nucleotide sequences (no gaps in sequences, sequence starts with nucleotide corresponding to 1st codon position) Select view as proteins
Codon based alignments in Seaview With the protein sequences displayed, align sequences Select view as nucleotides
sites versus branches You can determine omega for the whole dataset; however, usually not all sites in a sequence are under selection all the time. PAML (and other programs) allow to either determine omega for each site over the whole tree, , or determine omega for each branch for the whole sequence, . It would be great to do both, i.e., conclude codon 176 in the vacuolar ATPases was under positive selection during the evolution of modern humans – alas, a single site does not provide much statistics ….
Sites model(s) work great have been shown to work great in few instances. The most celebrated case is the influenza virus HA gene. A talk by Walter Fitch (slides and sound) on the evolution ofthis molecule is here . This article by Yang et al, 2000 gives more background on ml aproaches to measure omega. The dataset used by Yang et al is here: flu_data.paup .
sites model in MrBayes The MrBayes block in a nexus file might look something like this: begin mrbayes; set autoclose=yes; lset nst=2 rates=gamma nucmodel=codon omegavar=Ny98; mcmcp samplefreq=500 printfreq=500; mcmc ngen=500000; sump burnin=50; sumt burnin=50; end;
the same after rescaling the y-axis plot LogL to determine which samples to ignore
copy paste formula enter formula for each codon calculate the the average probability plot row
To determine credibility interval for a parameter (here omega<1): Select values for the parameter, sampled after the burning. Copy paste to a new spreadsheet,
Sort values according to size, • Discard top and bottom 2.5% • Remainder gives 95% credibility interval.
Purifying selection in GTA genes dN/dS <1 for GTA genes has been used to infer selection for function GTA genes Lang AS, Zhaxybayeva O, Beatty JT. Nat Rev Microbiol. 2012 Jun 11;10(7):472-82 Lang, A.S. & Beatty, J.T. Trends in Microbiology , Vol.15, No.2 , 2006
Purifying selection in E.coli ORFans dN-dS < 0 for some ORFan E. coli clusters seems to suggest they are functional genes. Adapted after Yu, G. and Stoltzfus, A. Genome Biol Evol (2012) Vol. 4 1176-1187
Counting Algorithm X=2 1 nucleotide substitution 1 non-synonymous change X=2 1 amino acid substitution
Evolution of Coding DNA Sequences Under a Neutral ModelE. coli Prophage Genes Count distribution Probability distribution n=90 Non-synonymous n= 90 k= 24 p=0.763 P(≤24)=3.63E-23 n= 90 k= 66 p=0.2365 P(≥66)=3.22E-23 Observed=24 P(≤24) < 10-6 Observed=66 P(≥66) < 10-6 n=90 Synonymous
Evolution of Coding DNA Sequences Under a Neutral ModelE. coli Prophage Genes Probability distribution Count distribution n=375 Synonymous n= 723 k= 498 p=0.232 P(≥498)=6.41E-149 n= 375 k= 243 p=0.237 P(≥243)=7.92E-64 Observed=498 P(≥498) < 10-6 Observed=243 P(≥243) < 10-6 n=723 Synonymous
Evolution of Coding DNA Sequences Under a Neutral ModelE. coli Prophage Genes Values well below the p=0.01 threshold suggest that we can reject the null hypothesis of neutral evolution of prophage sequences.
Evolution of Coding DNA Sequences Under a Neutral ModelB. pseudomallei Cryptic MalleilactoneOperon Genes and E. coli transposase sequences
Trunk-of-my-car analogy: Hardly anything in there is the is the result of providing a selective advantage. Some items are removed quickly (purifying selection), some are useful under some conditions, but most things do not alter the fitness. Could some of the inferred purifying selection be due to the acquisition of novel detrimental characteristics (e.g., protein toxicity, HOPELESS MONSTERS)?
Other ways to detect positive selection Selective sweeps -> fewer alleles present in population (see contributions from archaic Humans for example) Repeated episodes of positive selection -> high dN
Y chromosome Adam Mitochondrial Eve Lived approximately 40,000 years ago Lived 166,000-249,000 years ago Thomson, R. et al. (2000) Proc Natl Acad Sci U S A 97, 7360-5 Underhill, P.A. et al. (2000) Nat Genet 26, 358-61 Mendez et al. (2013) American Journal of Human Genetics 92 (3): 454. Cann, R.L. et al. (1987) Nature 325, 31-6 Vigilant, L. et al. (1991) Science 253, 1503-7 Albrecht Dürer, The Fall of Man, 1504 Adam and Eve never met The same is true for ancestral rRNAs, EF, ATPases!
From: http://www.nytimes.com/2012/01/31/science/gains-in-dna-are-speeding-research-into-human-origins.html?_r=1
The multiregional hypothesis From http://en.wikipedia.org/wiki/Multiregional_Evolution
Did the Denisovans Cross Wallace's Line? Science 18 October 2013: vol. 342 no. 6156 321-323 Ancient migrations. The proportions of Denisovan DNA in modern human populations are shown as red in pie charts, relative to New Guinea and Australian Aborigines (3). Wallace's Line (8) is formed by the powerful Indonesian flow-through current (blue arrows) and marks the limit of the Sunda shelf and Eurasian placental mammals.
Archaic human admixture with modern Homo sapiens From: http://en.wikipedia.org/wiki/Archaic_human_admixture_with_modern_Homo_sapiens
For more discussion on archaic and early humans see: http://en.wikipedia.org/wiki/Denisova_hominin http://www.nytimes.com/2012/01/31/science/gains-in-dna-are-speeding-research-into-human-origins.html http://www.sciencedirect.com/science/article/pii/S0002929711003958 http://www.abc.net.au/science/articles/2012/08/31/3580500.htm http://www.sciencemag.org/content/334/6052/94.full http://www.sciencemag.org/content/334/6052/94/F2.expansion.html http://haplogroup-a.com/Ancient-Root-AJHG2013.pdf
PSI (position-specific iterated) BLAST The NCBI page described PSI blast as follows: “Position-Specific Iterated BLAST (PSI-BLAST) provides an automated, easy-to-use version of a "profile" search, which is a sensitive way to look for sequence homologues. The program first performs a gapped BLAST database search. The PSI-BLAST program uses the information from any significant alignments returned to construct a position-specific score matrix, which replaces the query sequence for the next round of database searching. PSI-BLAST may be iterated until no new significant alignments are found. At this time PSI-BLAST may be used only for comparing protein queries with protein databases.”
The Psi-Blast Approach 1. Use results of BlastP query to construct a multiple sequence alignment 2. Construct a position-specific scoring matrix from the alignment 3. Search database with alignment instead of query sequence 4. Add matches to alignment and repeat Psi-Blast can use existing multiple alignment, or use RPS-Blast to search a database of PSSMs
Position-specific Matrix by Bob Friedman M Gribskov, A D McLachlan, and D Eisenberg (1987) Profile analysis: detection of distantly related proteins. PNAS 84:4355-8.
Psi-Blast Results link to sequence here, check BLink Query: 55670331 (intein)
PSI BLAST and E-values! Psi-Blast is for finding matches among divergent sequences (position-specific information) WARNING: For the nth iteration of a PSI BLAST search, the E-value gives the number of matches to the profile NOT to the initial query sequence! The danger is that the profile was corrupted in an earlier iteration.
PSI Blast from the command line Often you want to run a PSIBLAST search with two different databanks - one to create the PSSM, the other to get sequences:To create the PSSM: blastpgp -d nr -i subI -j 5 -C subI.ckp -a 2 -o subI.out -h 0.00001 -F f blastpgp -d swissprot -i gamma -j 5 -C gamma.ckp -a 2 -o gamma.out -h 0.00001 -F f Runs 4 iterations of a PSIblast the -h option tells the program to use matches with E <10^-5 for the next iteration, (the default is 10-3 ) -C creates a checkpoint (called subI.ckp), -o writes the output to subI.out, -i option specifies input as using subI as input (a fasta formated aa sequence). The nr databank used is stored in /common/data/ -a 2 use two processors -h e-value threshold for inclusion in multipass model [Real] default = 0.002 THIS IS A RATHER HIGH NUMBER!!! (It might help to use the node with more memory (017) (command is ssh node017)
To use the PSSM: blastpgp -d /Users/jpgogarten/genomes/msb8.faa -i subI -a 2 -R subI.ckp -o subI.out3 -F f blastpgp -d /Users/jpgogarten/genomes/msb8.faa -i gamma -a 2 -R gamma.ckp -o gamma.out3 -F f Runs another iteration of the same blast search, but uses the databank /Users/jpgogarten/genomes/msb8.faa -R tells the program where to resume -d specifies a different databank -i input file - same sequence as before -o output_filename -a 2 use two processors -h e-value threshold for inclusion in multipass model [Real] default = 0.002. This is a rather high number, but might be ok for the last iteration.
PSI Blast and finding gene families within genomes • 2nd step: use PSSM to search genome: • Use protein sequences encoded in genome as target: blastpgp -d target_genome.faa -i query.name -a 2 -R query.ckp -o query.out3 -F f B) Use nucleotide sequence and tblastn. This is an advantage if you are also interested in pseudogenes, and/or if you don’t trust the genome annotation: blastall -i query.name -d target_genome_nucl.ffn -p psitblastn -R query.ckp
Psi-Blast finds homologs among divergent sequences (position-specific information) WARNING: For the nth iteration of a PSI BLAST search, the E-value gives the number of matches to the profile NOT to the initial query sequence! The danger is that the profile was corrupted in an earlier iteration.