Neutral mutations
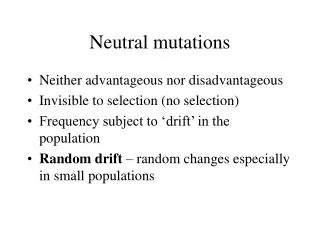
Neutral mutations. Neither advantageous nor disadvantageous Invisible to selection (no selection) Frequency subject to ‘drift’ in the population Random drift – random changes especially in small populations. Positive selection.

Neutral mutations
E N D
Presentation Transcript
Neutral mutations • Neither advantageous nor disadvantageous • Invisible to selection (no selection) • Frequency subject to ‘drift’ in the population • Random drift – random changes especially in small populations
Positive selection • A new allele (mutant) confers some increase in the fitness of the organism • Selection acts to favour this allele • Also called adaptive selection or Darwinian selection, and, in case of repeated positive selection, diversifying selection. NOTE: Fitness = ability to survive and reproduce Modified from from www.tcd.ie/Genetics/staff/Aoife/GE3026/GE3026_1+2.ppt
Random Genetic Drift Selection 100 advantageous Allele frequency disadvantageous 0 Modified from from www.tcd.ie/Genetics/staff/Aoife/GE3026/GE3026_1+2.ppt
Negative selection • A new allele (mutant) confers some decrease in the fitness of the organism • Selection acts to remove this allele • Also called purifying selection Modified from from www.tcd.ie/Genetics/staff/Aoife/GE3026/GE3026_1+2.ppt
Types of Mutation-Substitution • Replacement of one nucleotide by another • Synonymous (Doesn’t change amino acid) • Rate sometimes indicated by Ks • Rate sometimes indicated by ds • Non-Synonymous (Changes Amino Acid) • Rate sometimes indicated by Ka • Rate sometimes indicated by dn (this and the following 4 slides are from mentor.lscf.ucsb.edu/course/ spring/eemb102/lecture/Lecture7.ppt)
Genetic Code – Note degeneracy of 1st vs 2nd vs 3rd position sites
Genetic Code Four-fold degenerate site – Any substitution is synonymous From: mentor.lscf.ucsb.edu/course/spring/eemb102/lecture/Lecture7.ppt
Genetic Code Two-fold degenerate site – Some substitutions synonymous, some non-synonymous From: mentor.lscf.ucsb.edu/course/spring/eemb102/lecture/Lecture7.ppt
Measuring Selection on Genes • Null hypothesis = neutral evolution • Under neutral evolution, synonymous changes should accumulate at a rate equal to mutation rate • Under neutral evolution, amino acid substitutions should also accumulate at a rate equal to the mutation rate From: mentor.lscf.ucsb.edu/course/spring/eemb102/lecture/Lecture7.ppt
Counting #s/#a Ser Ser Ser Ser Ser Species1 TGA TGC TGT TGT TGT Ser Ser Ser Ser Ala Species2 TGT TGT TGT TGT GGT #s = 2 sites #a = 1 site #a/#s=0.5 To assess selection pressures one needs to calculate the rates (Ka, Ks), i.e. the occurring substitutions as a fraction of the possible syn. and nonsyn. substitutions. Things get more complicated, if one wants to take transition transversion ratios and codon bias into account. See chapter 4 in Nei and Kumar, Molecular Evolution and Phylogenetics. Modified from: mentor.lscf.ucsb.edu/course/spring/eemb102/lecture/Lecture7.ppt
Low number of polymorphisms Other approaches: A selective sweep decreases the number of polymorphisms present in a population surrounding the gene that was driven into fixation due to positive selection. This provides an alternative to dN/dS ratios to detect genes under positive selection. Number of non-synonymous substitutions large dN If a site or a gene repeatedly was driven into fixation due to positive selection, its substitution rate will be higher than the mutation rate. This diversifying selection is frequently observed for sites interacting with immune system.
dambe Two programs worked well for me to align nucleotide sequences based on the amino acid alignment, One is DAMBE (only for windows). This is a handy program for a lot of things, including reading a lot of different formats, calculating phylogenies, it even runs codeml (from PAML) for you. The procedure is not straight forward, but is well described on the help pages. After installing DAMBE go to HELP -> general HELP -> sequences -> align nucleotide sequences based on …-> If you follow the instructions to the letter, it works fine. DAMBE also calculates Ka and Ks distances from codon based aligned sequences.
aa based nucleotide alignments (cont) An alternative is the tranalign program that is part of the emboss package. On bbcxsrv1 (the machine at UConn’s Bioinformatics facility) you can invoke the program by typing tranalign. Instructions and program description are here .
omega = dN/dS According to the model: omega < 1 purifying selection omega = 1 neutral evolution omega > 1 positive selection Concern: If a gene is expressed, codon usage, nucleotide bias and other factors (protein toxicity) will generate some purifying selection even though the gene might not have a function that is selected for. I.e., omega < 1 could be due to avoiding deleterious functions, rather than the loss of function. Most proteins coding genes have omega between 0 and 1.
The basic evolutionary model to detect positive selection is as follows (from the PAML (codeml) manual)
sites versus branches You can determine omega for the whole dataset; however, usually not all sites in a sequence are under selection all the time. PAML (and other programs) allow to either determine omega for each site over the whole tree, , or determine omega for each branch for the whole sequence, . It would be great to do both, i.e., conclude codon 176 in the vacuolar ATPases was under positive selection during the evolution of modern humans – alas, a single site does (usually) not provide any statistics ….
Sites model(s) work great have been shown to work great in few instances. The most celebrated case is the influenza virus HA gene. A talk by Walter Fitch (slides and sound) on the evolution ofthis molecule is here . This article by Yang et al, 2000 gives more background on ml aproaches to measure omega. The dataset used by Yang et al is here: flu_data.paup .
Programs that allow to calculate dN/dS PAML (http://abacus.gene.ucl.ac.uk/software/paml.html) MrBayes (http://mrbayes.scs.fsu.edu/) HyPhy (http://www.hyphy.org/)
sites model in MrBayes The MrBayes block in a nexus file might look something like this: begin mrbayes; #(set autoclose=yes; )lset nst=2 rates=gamma nucmodel=codon omegavar=Ny98; mcmcp samplefreq=500 printfreq=500; mcmc ngen=500000; sump burnin=50; sumt burnin=50; end;
MrBayes on bbcxrv1 Create the nexus file on your computer. It will help to have MrBayes installed locally, this way you can check that you don’t have any typos in the MrBayes block. Direct your browser to http://bbcxsrv1.biotech.uconn.edu/bipod/index.html Sample file here.
MrBayes on bbcxrv1 Select the plus and then MrBayes in the sub-menu
submit your job check your email upload your nexusfile MrBayes on bbcxrv1
MrBayes on bbcxrv1 You will receive the results per email, and you will receive the link of a web page that lists all the output files. In this case: http://bbcxsrv1.biotech.uconn.edu/pise/tmp/A10700111431640/results.html You can save the files from your browser, or open the email attachments. . The files we are particularily interested in are the parameter file and the MrBayes output (to check for potential problems).
MrBayes -- analyzing the *.nex.p file • The easiest is to load the file into excel. (If your alignment is too long, you need to load the data into separate spead sheets – see here execise 2 item 2 for more info) • plot LogL to determine which samples to ignore • for each codon calculate the the average probability (from the samples you do not ignore) that the codon belongs to the group of codons with omega>1. • plot this quantity using a bar graph.
the same after rescaling the y-axis plot LogL to determine which samples to ignore
copy paste formula plot row enter formula for each codon calculate the the average probability example spreadsheet is here
MrBayes on bbcxrv1 • If you do this for your own data, • run the procedure first for only 50000 generations (takes about 30 minutes) to check that everthing works as expected, • then run the program overnight for at least 500 000 generations. • Especially, if you have a large dataset, do the latter twice and compare the results for consistency (MrBayes3.1 is doing this automatically!).
PAML – codeml – sites model the paml package contains several distinct programs for nucleotides (baseml) protein coding sequences and amino acid sequences (codeml) and to simulate sequences evolution. The input file needs to be in phylip format. By default it assumes a sequential format (e.g. here). If the sequences are interleaved, you need to add an “I” to the first line, as in these example headers: 6 467 Igi|1613157 ---------- MSDNDTIVAQ ATPPGRGGVG ILRISGFKAR EVAETVLGKL gi|2212798 ---------- MSTTDTIVAQ ATPPGRGGVG ILRVSGRAAS EVAHAVLGKL gi|1564003 MALIQSCSGN TMTTDTIVAQ ATAPGRGGVG IIRVSGPLAA HVAQTVTGRT gi|1560076 ---------M QAATETIVAI ATAQGRGGVG IVRVSGPLAG QMAVAVSGRQ gi|2123365 -----MN--- -ALPSTIVAI ATAAGTGGIG IVRLSGPQSV QIAAALGIAG gi|1583936 -----MSQRS TKMGDTIAAI ATASGAAGIG IIRLSGSLIK TIATGLGMTT PKPRYADYLP FKDADGSVLD QGIALWFPGP NSFTGEDVLE LQGHGGPVIL PKPRYADYLP FKDVDGSTLD QGIALYFPGP NSFTGEDVLE LQGHGGPVIL LRPRYAEYLP FTDEDGQQLD QGIALFFPNP HSFTGEDVLE LQGHGGPVVM LKARHAHYGP FLDAGGQVID EGLSLYFPGP NSFTGEDVLE LQGHGGPVVL LQSRHARYAR FRDAQGEVID DGIAVWFPAP HSFTGEEVVE LQGHGSPVLL LRPRYAHYTR FLDVQDEVID DGLALWFPAP HSFTGEDVLE LQGHGSPLLL 5 855 I human goat-cow rabbit rat marsupial 1 GTG CTG TCT CCT GCC GAC AAG ACC AAC GTC AAG GCC GCC TGG GGC AAG GTT GGC GCG CAC ... ... ... G.C ... ... ... T.. ..T ... ... ... ... ... ... ... ... ... .GC A.. ... ... ... ..C ..T ... ... ... ... A.. ... A.T ... ... .AA ... A.C ... AGC ... ... ..C ... G.A .AT ... ..A ... ... A.. ... AA. TG. ... ..G ... A.. ..T .GC ..T ... ..C ..G GA. ..T ... ... ..T C.. ..G ..A ... AT. ... ..T ... ..G ..A .GC ... 61 GCT GGC GAG TAT GGT GCG GAG GCC CTG GAG AGG ATG TTC CTG TCC TTC CCC ACC ACC AAG ... ..A .CT ... ..C ..A ... ..T ... ... ... ... ... ... AG. ... ... ... ... ... .G. ... ... ... ..C ..C ... ... G.. ... ... ... ... T.. GG. ... ... ... ... ... .G. ..T ..A ... ..C .A. ... ... ..A C.. ... ... ... GCT G.. ... ... ... ... ... ..C ..T .CC ..C .CA ..T ..A ..T ..T .CC ..A .CC ... ..C ... ... ... ..T ... ..A
PAML – codeml – sites model (cont.) the program is invoked by typing codeml followed by the name of a control file that tells the program what to do. paml can be used to find the maximum likelihood tree, however, the program is rather slow. Phyml is a better choice to find the tree, which then can be used as a user tree. An example for a codeml.ctl file is codeml.hv1.sites.ctl This file directs codeml to run three different models: one with an omega fixed at 1, a second where each site can be either have an omega between 0 and 1, or an omega of 1, and third a model that uses three omegas as described before for MrBayes. The output is written into a file called Hv1.sites.codeml_out (as directed by the control file). Point out log likelihoods and estimated parameter line (kappa and omegas) Additional useful information is in the rst file generated by the codeml Discuss overall result.
PAML – codeml – branch model For the same dataset to estimate the dN/dS ratios for individual branches, you could use this file codeml.hv1.branches.ctl as control file. The output is written, as directed by the control file, into a file called Hv1.branch.codeml_out A good way to check for episodes with plenty of non-synonymous substitutions is to compare the dn and ds trees. Also, it might be a good idea to repeat the analyses on parts of the sequence (using the same tree). In this case the sequences encode a family of spider toxins that include the mature toxin, a propeptide and a signal sequence (see here for more information). Bottom line: one needs plenty of sequences to detect positive selection.
PAML – codeml – branch model dS -tree dN -tree
where to get help read the manuals and help files check out the discussion boards at http://www.rannala.org/phpBB2/ else there is a new program on the block called hy-phy(=hypothesis testing using phylogenetics). The easiest is probably to run the analyses on the authors datamonkey.
hy-phy Results of an anaylsis using the SLAC approach