Changes in Consumption Patterns: ANOVA
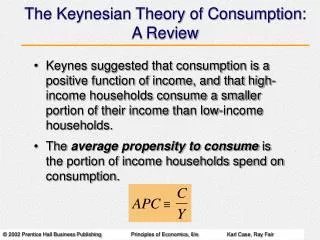
Changes in Consumption Patterns: ANOVA. Consumption Patterns: Importance. 1. Total consumption accounts for more than two-thirds of national income in many countries, largest component having implications for the state of the economy.

Changes in Consumption Patterns: ANOVA
E N D
Presentation Transcript
Changes in Consumption Patterns: ANOVA Source: Babu and Sanyal (2009)
Consumption Patterns: Importance 1. Total consumption accounts for more than two-thirds of national income in many countries, largest component having implications for the state of the economy. 2. Important to know changes in pattern of consumption since it reveals changes in economic welfare and living standards – a measure of economic performance. Finally, 3. Facilitates understanding the price responsiveness of consumption required for microeconomic policy issues, which include the measurement of distortions, optimal taxation and the treatment of externalities. Changes in Consumption Patterns and Food Policy
Consumption Pattern & Food Security 1. Food security = f(Per capita availability of food , Changes in the composition of diet) • Causes of changes in diet: • Demographic and epidemiological transitions • Demographic transition occurs due to a shift from a pattern of high fertility and mortality to one of low fertility and mortality, • Epidemiological transition occurs due to a shift from a pattern of high prevalence of infectious disease associated with malnutrition, to one of high prevalence of chronic and degenerative diseases associated with urban lifestyles. • Nutritional outcomes of such transitions: Changes in body composition and morbidity. Changes in Consumption Patterns and Food Policy
Food Consumption Patterns: Determinants • Food consumption: • Quantity and quality of food intake by households/individuals • Good proxy: calorie or nutrient intake • Economic Devt & associated changes in CP • In addition to income & expenditure, rural–urban migration, changes in demographic structures and improvements in education, transport and communications, and marketing infrastructure would affect CPs. Changes in Consumption Patterns and Food Policy
Percentage distribution of calorie source by level of per capita GNP Changes in Consumption Patterns and Food Policy
ANOVA • ANOVA: To test if differences exist between two or more population means. • Populations pertain to interval data. • Procedure: Analyze sample variance. • Two variables: 1 Nominal , 1 Quantitative. • Suppose categorical variable has only 2 values, then we use 2-sample t-test. • Superiority of ANOVA: allows for 3 or more groups. Changes in Consumption Patterns and Food Policy
Descriptive Approach • Graphical investigation: • Juxtaposed box plots • Multiple histograms • How far the differences between groups are significant depends on • the difference in the means • the standard deviations of each group • the sample sizes Changes in Consumption Patterns and Food Policy
ANOVA ANOVA: Test of hypotheses about more than two population mean parameters: H0: The means of all the groups are equal. Ha: Not all the means are equal It doesn’t say how or which ones differ. It can also be extended to multiple comparisons Changes in Consumption Patterns and Food Policy
Assumptions • Each population follows normal distribution • Verify by drawing histograms and/or normal quantile plots, or use assumptions. • Valid even with non-normal populations but not so with outliers. • Standard deviations of each population are approximately equal • Verify if the ratio of largest to smallest sample st. dev. is greater than 2:1. Changes in Consumption Patterns and Food Policy
Normality Verification • Options for verification: • assumptions about population • histograms for each group • normal quantile plot for each group • No robust method when it comes to small samples; hence, assume normality. Changes in Consumption Patterns and Food Policy
Table 5.1 Food group shares (%) of household calorie intake for Malawi Changes in Consumption Patterns and Food Policy
Descriptive Statistics • Statistics: Mean and standard deviations of the food shares from the various groups. • As a proportion of the total household calorie intake, the mean share of maize was almost 64 per cent - maize is the dominant staple food crop in Malawi. • Roots and tubers (cassava, plantains and sweet potato) (16.5 per cent of total calorie intake). • Last: grains such as rice and sorghum. Changes in Consumption Patterns and Food Policy
Table 5.2 Mean share of calories from various food groups by expenditure brackets Changes in Consumption Patterns and Food Policy
Descriptive Statistics • Maize: Major source of calories followed by roots and tubers, and other grains (such as rice, sorghum). • Consumption preferences similar across quartiles. • For the higher expenditure groups, the share of calories from maize, which is a staple diet, declines while the share of calories from animal products, vegetables and dairy products increases; because with increase in incomes, households substitute a better variety of food (in calorie and dietary content) compared to maize, which usually has lower dietary value. Changes in Consumption Patterns and Food Policy
Table 5.3 One-way ANOVA for share of calories across expenditure quartiles Changes in Consumption Patterns and Food Policy
Test of Hypothesis • Reject the null hypothesis that the shares of calories from maize for the four expenditure groups are the same at the 5 per cent level. • Reject the null hypothesis that calorie shares of roots and tubers and meat, fish and eggs for households in all the expenditure groups are the same at the 5 and 1 per cent levels respectively. • The groups for which the null hypothesis cannot be rejected are other grains, milk, vegetables and pulses. Changes in Consumption Patterns and Food Policy
Inference • Malawi: • Most of the households consume maize as part of a staple diet in order to derive calories. • ANOVA: Calorie shares of maize for households in different expenditure groups are not the same. • Poorer households derive most of the calories from cereals such as maize. • As income of the households increases, there is greater substitution towards vegetables, milk and meat, fish and eggs. Thus, there is a tendency towards greater dietary diversity as income increases. Changes in Consumption Patterns and Food Policy