Download
1 / 35
350 likes | 436 Views
Explore modeling approaches for habitat supply in MPB-impacted landscapes, focusing on various wildlife species and ecosystems. Delve into effects of MPB, climate change, and management paradigms on species conservation. Learn about modeling challenges, merits, and common approaches used with selected species and their habitats.

E N D
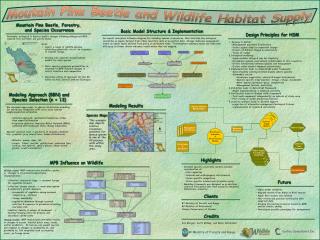
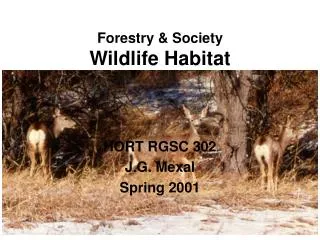
Habitat Supply for Multiple Wildlife in MPB Attacked Landscapes Modeling approach and selected species
Goals/Outcomes • Effects of: • Mountain pine beetle • Climate change • Uncertainty • Management paradigms • Conservation of species
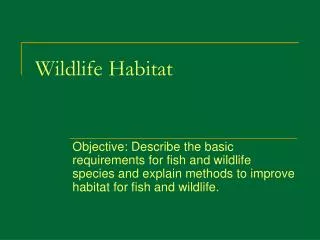
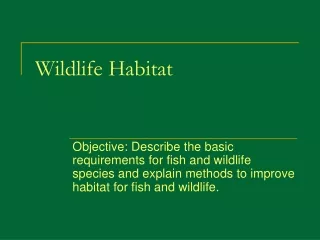
Challenges • Project was both broad and deep • Extensive • 15 million ha • Multiple wildlife species / variable ecosystems • Intensive • 70% Pl mortality • Habitat quality at 1-ha resolution • Multi-trophic • Range of user expectations
Merits/Demerits • Clear goals • Available tools • Experience • Love a good challenge!
Background • Selection of modeling approach • Selection of species • General model • Effect of MPB • Effect of Biogeoclimatic • Application • Results
Selection of Modeling Approach • Purpose – prediction / explanation • Algorithm structure – mechanistic / correlative • Ecological complexity – multi-trophic / singular • Treatment of time – forecast / static • Resolution (spatial/temporal/functional) – coarse / fine • Type of reasoning – inductive / deductive • Statistical foundation – frequency / probability • Outputs – capability / suitability • Type of result – deterministic / stochastic
Common Approaches • Element Distribution • Habitat Supply • Resource Selection Function • Habitat Suitability Index • Wildlife Habitat Rating
Chosen Approach • Bayesian-based habitat supply • Spatially referenced probability of occurrence • Sensitive to resource requirements • Not temporally/spatially limited • Explicit uncertainty • Relatively transparent and flexible • Mechanistic, multi-trophic, deductive, and deterministic way to forecast probabilistic explanations about habitat suitability at a relatively fine spatial, temporal, and functional resolution (whew! Never to be quoted please.)
Selection of Species • Most adversely affected by MPB and/or management response to MPB • Examples of hunted or trapped species • Closely related species that vary in habitat requirements
Criteria for Negatively Affected • CDC, COSEWIC status • Stakeholder interest • Extent of distribution in BC • Key ecological function • Relative dependence on pine • MPB threat on habitat structure • MPB related management threats
The 13 Species • Mape • Urar • Rata • Gugu • Spgr • Maam • Lewo • Tahu • Odhe • Lyca • Ceel • Alal • Stgr
Life requisite: dens/nests Management lever Life requisite: forage Composite effect: forage usefulness Life requisite: locomotion cost Subnet: Physical/ahabitat barriers Life requisite: thermal cover Composite effect: mortality potential Life requisite: security cover Subnet: Spatial factors General Model Structure Key ecological correlate Key ecological correlate Modifying factor: competition Modifying factor: displacement Key ecological correlate Species Occurrence Key ecological correlate Key ecological correlate Key ecological correlate Key ecological correlate Modifying factor: mortality sources
Model Application Input layers, data management, run sequence
Results Spatial results and meta-data
Alal Odhe Ceel Rata Maam Gugu Mape Lyca Lewo Stgr Spgr
Modeling Results • Mind map • Netica input variable palette • Netica manager • Spatial layers • Input • Output • Meta data
Issues: Data Management • MS Access 2 GB limit • Corrupted databases • Adds additional processing steps to compact database or import data to new database • Mid-model spatial processing • Unscripted and done manually • Time intensive • Can introduce error • CPU space • With 3-4 processing areas per machine, space becomes an issue • Data management can introduce error
Issues: VRI • Interpretation • Data management
Issues: Other Data • Interpretation • Data management
Scenario 3 Scenario 2 Scenario 1 Yr 10 Yr 0 Predator Prey Yr 20 Issues: Resources Species Habitat Relationships Habitat Supply Models Habitat Supply Management Alternatives Resource Inventory Disturbance Scheduler & Forest Estate Models Disturbance & Succession Inferred Pop’n Response Timber Supply & Landscape Conditions Interpretation
Solutions • Research input data / data management • Dump access • Simplify models (but no loss of precision) • Contemplate implications of model structure
Alpha- to Beta-level Models …and beyond
Why Alpha to Beta • Functional, multi-trophic models by their nature are complex and intricate • Application needs to be simple and uncomplicated
The Example of Mountain Caribou • Government wanted models that were transparent and mapped the thoughts of science advisors • Once built, they then wanted models that were easy to implement • Simplification based on sensitivity analyses and node reduction provided a pragmatic result that could be transferred to other modeling platforms
Other Possible Activities • Correction of errors (input data, scripting) • Adjustment of conditional probabilities • Addition/elimination of KECs • Realignment of relationships • Adjustment of input/output states (number and/or cutpoints) • Trials with “other” less restrictive software • Expert review of results • Verification of results with empirical information
Benefits • More reliable/applicable models • Easier and more efficient application • More readily transferred to different platforms