System Troubleshooting TCS
System Troubleshooting TCS. Network, System, and Load Monitoring TCS for Developers. LBT TCS Cluster. VLANS for private networks 6 Gb non-blocking, full duplex backbone. Latency, Throughput, Data Rate. Broadcast Multicast TCP/UDP Bottleneck at the desktop workstations. Networking.

System Troubleshooting TCS
E N D
Presentation Transcript
System Troubleshooting TCS Network, System, and Load Monitoring TCS for Developers
VLANS for private networks 6 Gb non-blocking, full duplex backbone. Latency, Throughput, Data Rate Broadcast Multicast TCP/UDP Bottleneck at the desktop workstations Networking
Diagnostics Theory • Memory bound versus CPU bound • Network throughput versus speed • Multithreading errors • Subsystem Interaction • printf and syslog • Standard Out and Standard Error
/sbin/tcpdump /sbin/ifconfig cacti top syslog top vmstat R gnuplot Monitoring and Diagnostic Tools
Interactive -lett -i <device> {limit} Device can be eth0 or eth0.20 for vlans Gather Only -i <device> -w <file> Gathers all raw packets and writes them to a file for processing later tcpdump
Reflective Memory [root@lbtmu107 ~]# tcpdump -i eth0 17:51:34.494273 IP 10.10.0.238.5000 > 10.10.0.255.5000: UDP, length 1028 17:51:34.494282 IP 10.10.0.238.5000 > 10.10.0.255.5000: UDP, length 60 17:51:34.494397 IP 10.10.0.239.5000 > 10.10.0.255.5000: UDP, length 60 17:51:34.494522 IP 10.10.0.240.5000 > 10.10.0.255.5000: UDP, length 60 17:51:34.494531 IP 10.10.0.241.5000 > 10.10.0.255.5000: UDP, length 60 17:51:34.504062 IP 10.10.0.245.5000 > 10.10.0.255.5000: UDP, length 60 17:51:34.504144 IP 10.10.0.248.5000 > 10.10.0.255.5000: UDP, length 60 17:51:34.504266 IP 10.10.0.238.5000 > 10.10.0.255.5000: UDP, length 1028
ifconfig [root@lbtmu01 ~]# ifconfig -a eth0 Link encap:Ethernet HWaddr 00:11:11:10:04:10 inet6 addr: fe80::211:11ff:fe10:410/64 Scope:Link UP BROADCAST RUNNING MULTICAST MTU:1500 Metric:1 RX packets:402698793 errors:0 dropped:0 overruns:0 frame:0 TX packets:74367255 errors:0 dropped:0 overruns:0 carrier:0 collisions:0 txqueuelen:1000 RX bytes:3500999197 (3.2 GiB) TX bytes:3982146708 (3.7 GiB) Base address:0xdf40 Memory:fbee0000-fbf00000 eth0.10 Link encap:Ethernet HWaddr 00:11:11:10:04:10 inet addr:10.144.0.131 Bcast:10.144.0.255 Mask:255.255.255.0 inet6 addr: fe80::211:11ff:fe10:410/64 Scope:Link UP BROADCAST RUNNING MULTICAST MTU:1500 Metric:1 RX packets:12609308 errors:0 dropped:0 overruns:0 frame:0 TX packets:9774513 errors:0 dropped:0 overruns:0 carrier:0 collisions:0 txqueuelen:0 RX bytes:2701235204 (2.5 GiB) TX bytes:1087406483 (1.0 GiB)
Cacti (http://ldap.lbto.arizona.edu/cacti/) • www.cacti.net • LDAP authentication • Customizable views • Full Deployment September, 2006
top • Time spent lost in system is probably io which includes networking • Sort by memory usage with “M” • Top inaccurately reports itself
vmstat Vmstat is a linux utility for monitoring virtual memory usage. It can also be used to track down I/O problems including networking. procs -----------memory---------- ---swap-- -----io---- --system-- ----cpu---- r b swpd free buff cache si so bi bo in cs us sy id wa 1 0 626164 533248 12488 64388 1 2 6 5 44 44 9 3 88 0 0 0 626164 533136 12488 64388 0 0 0 0 1613 1161 5 2 93 0 0 0 626164 533136 12496 64388 0 0 0 12 1642 1189 5 3 92 0 0 0 626164 533136 12496 64388 0 0 0 0 1645 1247 4 2 94 0 0 0 626164 533128 12496 64388 0 0 0 0 1640 1195 5 3 92 0 0 0 626164 533128 12496 64388 0 0 0 0 1631 1248 4 2 93 0 1 0 626164 533200 12496 64388 0 0 0 0 1674 1288 5 3 92 0 0 0 626164 533200 12496 64388 0 0 0 1 1622 1210 4 2 94 0 0 0 626164 533200 12500 64388 0 0 0 17 1705 1312 6 3 91 0 0 0 626164 533200 12500 64388 0 0 0 0 1649 1261 5 3 93 0
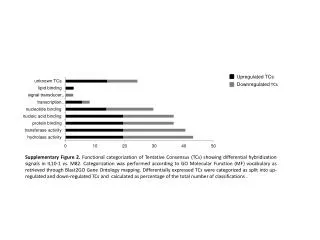
Statistical Analysis R, gnuplot, and Matlab All of these packages give you a different view of the data that you gather. Even if you are not comfortable with them, someone else might be. Graphs, Charts, baselines, etc…
Syslog /var/log/TCS/? [telescope@lbtmu01 ~]$ tail -f /var/log/TCS/user Jul 24 20:55:19 lbtmu105 LBT_ECS: Thermal failed to connect to IP 10.144.0.205 port 50010 Jul 24 20:55:20 lbtmu105 LBT_ECS: Thermal not connected to ThermalBox, Send Cmd failed Jul 24 20:55:32 lbtmu105 LBT_ECS: Thermal failed to connect to IP 10.144.0.205 port 50010 Jul 24 20:55:33 lbtmu105 LBT_ECS: Thermal not connected to ThermalBox, Send Cmd failed Jul 24 20:55:43 lbtmu103 last message repeated 58 times Jul 24 20:55:45 lbtmu105 LBT_ECS: Thermal failed to connect to IP 10.144.0.205 port 50010 Jul 24 20:55:46 lbtmu105 LBT_ECS: Thermal not connected to ThermalBox, Send Cmd failed Jul 24 20:55:58 lbtmu105 LBT_ECS: Thermal failed to connect to IP 10.144.0.205 port 50010 Jul 24 20:55:59 lbtmu105 LBT_ECS: Thermal not connected to ThermalBox, Send Cmd failed