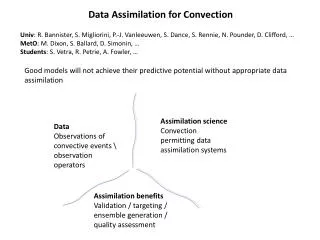
Data Assimilation for the PETM 56 Million Years Ago
Data Assimilation for the PETM 56 Million Years Ago. Mingsong Li Penn State | Geosciences & ADAPT. Fuqing Zhang, Lee Kump. Andy Ridgwell, Brewster Malevich, Jess Tierney, Greg Hakim, Robert Tardif, Jiang Zhu, Chris Poulsen. ODP. South Atlantic Ocean.

Data Assimilation for the PETM 56 Million Years Ago
E N D
Presentation Transcript
Data Assimilation for the PETM56 Million Years Ago MingsongLi PennState|Geosciences&ADAPT Fuqing Zhang, Lee Kump AndyRidgwell,Brewster Malevich,Jess Tierney,GregHakim,Robert Tardif,JiangZhu,ChrisPoulsen
ODP SouthAtlanticOcean https://en.wikipedia.org/wiki/JOIDES_Resolution oceanacidification,globalwarming,sealevelrise,… (almost) everything you ever wanted to know about the future Kennett&Stott,1991Nature Zachosetal.,2005Science
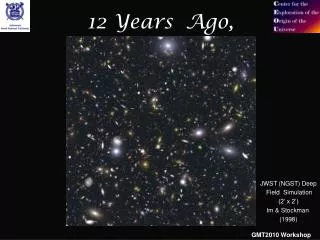
The Past is the Key to Forecasting the Future Paleocene–Eocene Thermal Maximum Kump,2011 Carbon release to atmosphere 10 times faster than in the past (Cuietal.,2011Nat.Geosci.)
Whatdidweknow? Data–Modelcomparison Dunkley Jones et al. (2013) Global mean surface temperature(SST) anomaly for the PETM is within the range of 4-5 °C
Whatwedo ThefirstDAstudyforthePETMwillanswerquestions: HowhotwasitduringthePETM? Where should we deploy observationsforPETMstudies?
Prior:cGENIEEarthsystemmodel atmosphere http://seao2.info • cGENIEmodel Eocene 36 x 36 (10°lon.x~5°lat.)configuration,ocean:16layers 75-memberensemble pCO2rangesfrom4-18Xpresent atmospheric level(1120–5040ppm) Steadystateafter10,000yearsspin-uptime
SSTpaleoclimateproxy TEX86☆ δ18OO Mg/Ca△ Size:proxydatanumbers
PETMSSTPosterior:ensemblemeanandvariance (onlyδ18O assimilated) Iteration#1 Iteration#2 Iteration#3 Iteration#24
PETM DA(δ18Oonly) 33.3°C very preliminary, maybe incorrect result
Challenge:Largemisfitbetweenproxyandprior(+ProxySystemMap) SiteIB10B Site401 Prior+PSM Posterior Proxy (Mg/Ca) Posterior Prior+PSM Proxy(TEX86) TEX86 Mg/Ca
PETM DA Challenge:Additional large uncertainties? (Mg/Ca dataonly) GlobalmeanSST (TEX86 dataonly) GlobalmeanSST Diagenesis(destroying primary signal),vital effects(biological processes overriding environmental signals)
Impactfactor: pre-analysis post-analysis sumofcovariancebetweenthegivensiteandallsites TraceofPb-Pa= varianceofstatevariable observationvariance (HamillandSnyder,2002;Stuartetal.,2007;Beietal.,2012;Xieetal.,2013)
Impactfactor: TraceofPb-Pa= Impact sumofcovariancebetweenthegivensiteandallsites
Evaluatingimpactfactor Hypothesis:Asitewithahigherimpactfactorhasbetterperformancetoreducetheproxy-priormisfit,and vice versa Misfitbetweenpriorandproxy(beforeassimilation) Misfitbetweenposteriorandproxy(afterassimilation) Evaluation - Reducedmisfit=
Evaluatingimpactfactor IB10b IB10a TEX86=0.935 TEX86=0.928 Fur,Denmark TEX86dataonly R=0.362 R=0.843 Nice,butacoupleofoutliers?
Futurework Howtoevaluateadditional large uncertaintiesinproxydata? Willmoreδ18OandMg/Ca databehelpfulforevaluationofimpactfactor?