Download
1 / 17
170 likes | 244 Views
Learn how Aggregate Supply and Demand models help analyze macroeconomic systems with real-world examples. Explore the AD/AS graph intersections, economic adjustments, inflation theories, expansionary gaps, recession impacts, and policy responses. Understand the concepts of GDP gaps, inflation, unemployment, natural output levels, and economic cycles.

E N D
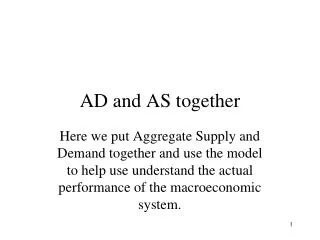
AD and AS together Here we put Aggregate Supply and Demand together and use the model to help use understand the actual performance of the macroeconomic system.
I would like to use another analogy here – this one from the world of medicine. Have you every had a sinus infection? No fun! Can you live with a sinus infection and have the infection go away without any hands on interventionfrom a doctor? The answer is yes, but why would you want to in modern America? Please think about this! Sometimes we may want a hands off approach.
A point about the method When we talked about Aggregate Supply we made it a point to distinguish between the short run and the long run. We are always in a short run and are moving toward a long run. In AD/AS graphs we use from here out focus your attention on the AD - SRAS intersection and if this happens at a place other than where LRAS, then an automatic adjustment will happen in the economy as we talked about during our discussion about SRAS. The adjust will include a shift of the SRAS curve.
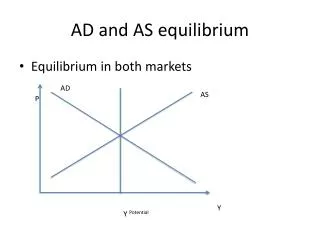
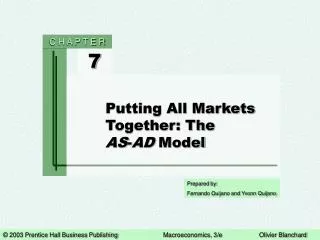
Equilibrium P LRAS AD1 SRAS1 P1 RGDP RGDP1
Equilibrium On the previous slide we have the AD curve cross the SRAS exactly where the SRAS crosses the LRAS. This is our usual starting point. Note the price level is determined at this intersection and the level of RGDP is determined at this point. The economy would stay at this point and then we observe price level P1 and RGDP level RGDP1 in the economy if every thing else stayed the same. The real world, though, is one of change and things will not stay the same. Let’s see how our model works here.
Rise in AD P LRAS AD1 SRAS1 P2 P1 AD2 RGDP1 RGDP2 RGDP
Rise in AD Say that AD rises. Since at P1 the AS is at RGDP1 and the AD is more, the national economy shortage will pull the price level up and firms will follow along the SRAS by adjusting input usage. The short term impact is to have the price level rise and the level of RGDP rise. The increase in the price level is called inflation. We have a demand theory of inflation. If demand rises the level of prices will rise. This is a demand pull theory of inflation.
Rise in AD The distance RGDP2 - RGDP1 is called an expansionary or positive GDP gap. It is the gap by which the economy has expanded above the natural pace of the economy. The expansionary gap will naturally go away in the long run if nothing else changes. The way this will happen is the input prices will eventually rise because resources are being worked hard. With higher input prices the SRAS shifts to SRAS2 and the economy is back at the natural level of output, although at a higher price level. We see this on the next slide. Again, the time frame of the adjustment may lead policy makers to take action before the long run natural mechanism can take place.
In the long run an increase in AD only changes the price level (to P3). Rise in AD P LRAS SRAS2 P3 AD1 SRAS1 P2 P1 AD2 RGDP1 RGDP2 RGDP
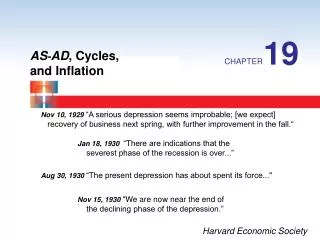
Fall in SRAS P LRAS SRAS2 AD1 SRAS1 P1 RGDP RGDP1 10
Fall in SRAS On the previous slide say we have a oil prices spike up high or some other widely used input has an increase in price. This input price rise can cause SRAS to shift left. We would then have inflation with reduced output. The reduced output would be recognized as a recession with more unemployment and the higher price would be inflation. If nothing is done from a policy perspective the recession and unemployment would eventually lead to lower input prices as inputs simply seek employment. Eventually the SRAS would shift back to SRAS1. But, if this takes a long time the unemployment may cause policy makers to want to increase AD without waiting for SRAS to shift out. This would cure the unemployment, but would mean even more inflation. (see this on the next slide)
Fall in SRAS P LRAS SRAS2 AD1 SRAS1 P1 RGDP RGDP1 12
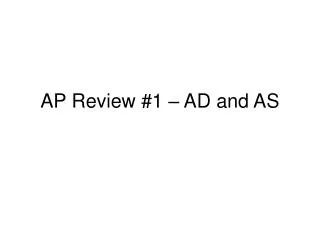
Fall in AD P LRAS AD1 SRAS1 P1 AD2 P2 RGDP2 RGDP RGDP1
Fall in AD Imagine AD falls (we have mentioned before why this might happen). Since at P1 the AS is at RGDP1 and the AD is less, the national economy surplus will pull the price level down and firms will follow along the SRAS by adjusting input usage. The short term impact is to have the price level fall and the level of RGDP fall. If the RGDP fall is for two consecutive calendar quarters or more, the decline in RGDP is called a recession. If the recession is considered severe the recession is called a depression. The decline in the price level is called deflation.
Fall in AD Now, as the AD falls the RGDP level falls and when we produce less the unemployment rate could rise. Although this is not explicit in the graph, be aware of this. The fall in RGDP in the example is RGDP2 – RGDP1. The distance RGDP1 – RGDP2 is called a contractionary or negative GDP gap. It is the gap by which in the economy the level of RGDP is has contracted short of the long run pace of the economy.
Fall in AD P LRAS AD1 SRAS1 SRAS2 P1 AD2 P2 RGDP2 RGDP RGDP1
Fall in AD If the fall in AD is persistent, the resources will be under used (unemployment) and eventually wages and other input prices will fall. SRAS1 will shift out to SRAS2 and the economy will be back in line with LRAS, although at a lower price level. Conclusion: A fall in AD may cause a recession in the short term, but in the long term will only cause the price level to decline. Note the economy can pull out of a recession on its own, but it may take a great deal of time. Perhaps we as a nation will not want to wait and we will have put into play expansionary monetary and/or fiscal policy.