Download
1 / 26
280 likes | 477 Views
Explore the positive and negative couplings in Earth's systems, including atmospheric CO2, daisy growth, and car dynamics. Learn how these components interact and influence one another through feedback loops. Investigate equilibrium states and responses to external forcings.

E N D
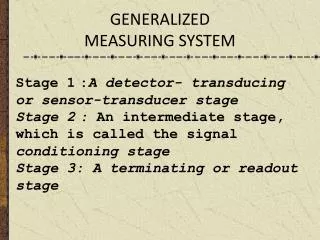
Systems Notation = system component = positive coupling = negative coupling
Positive Coupling Car’s speed Car’s gas pedal Body weight Amount of food eaten A change in one component leads to a change of the same direction in the linked component
Positive Coupling Atmospheric CO2 Greenhouse effect • An increase in atmospheric CO2 causes • a corresponding increase in the greenhouse • effect, and thus in Earth’s surface temperature • Conversely, a decrease in atmospheric CO2 • causes a decrease in the greenhouse effect
Negative Coupling Car’s speed Car’s break system Body weight Exercise A change in one component leads to a change of the opposite direction in the linked component
Negative Coupling Earth’s albedo (reflectivity) Earth’s surface temperature • An increase in Earth’s albedo causes a • corresponding decrease in the Earth’s surface • temperature by reflecting more sunlight back to • space • Or, a decrease in albedo causes an increase in • surface temperature
positive coupling parents’ anger childrens’ noise negative coupling
Negative Feedback Loops: Electric Blankets person A’s body temperature person A’s blanket temperature person B’s blanket temperature person B’s body temperature
A Positive Feedback Loop: Mixed-up Electric Blankets person A’s blanket temperature person A’s body temperature person B’s blanket temperature person B’s body temperature
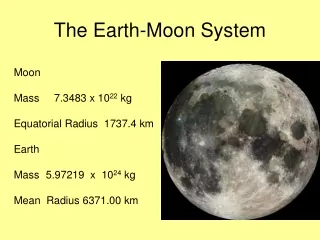
A simplified climate system: • Daisyworld • Average Temperature = 30 oC • No clouds, no ocean • Soil = light gray (absorbs some light) • Life = white daisies (reflects all light) • Sun = like Earth’s • Daisy growth = changes with temperature
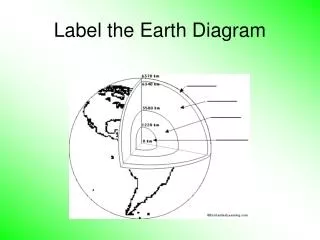
Albedo: measure of reflectivity of a surface, expressed as a % of reflected insolation to incoming insolation. (Christopherson, Elemental Geosystems, 2004)
albedo=0.75 albedo = 0.5
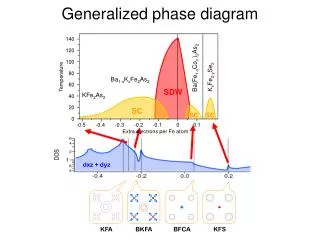
Systems diagram Response of average surface temperature to daisy coverage
completely covered planet 22.5 °C 40 °C 5 °C
Equilibrium States: Graphical Determination • Overlay the two graphs (this is the graphical way of setting them equal to each other). • The points where they meet are equilibrium points. • Draw a systems diagram to determine whether each one is stable or unstable.
The Faint Young Sun Problem More H2O Kasting et al., Scientific American (1988)
Systems diagram Response of average surface temperature to daisy coverage
External Forcing: the response of Daisy World • Assume that the external forcing is an increase in solar luminosity • The effect of temperature on daisy coverage should not change (this depends on the physiology of daisies) • The effect of daisy coverage on temperature should change: for the same daisy coverage, higher temperature