Download
1 / 13
130 likes | 338 Views
NEBRASKA STATE ACCOUNTABILITY. Understanding NeSA Raw Scores & Scale Scores 2010-2011 ESU 8. Where do we find important information regarding NeSA ? www.education.ne.gov/Assessment. * “ Leadership in Using NeSA Data” PowerPoint. NeSA.

E N D
NEBRASKA STATE ACCOUNTABILITY Understanding NeSA Raw Scores & Scale Scores 2010-2011 ESU 8
Where do we find important information regarding NeSA? www.education.ne.gov/Assessment * “Leadership in Using NeSA Data” PowerPoint
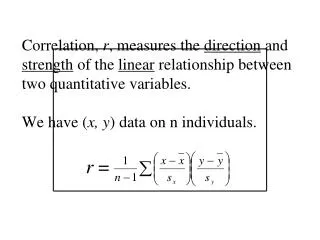
NeSA . . . • Araw score is the number of test items the student answered correctly. • The raw score is converted to a scale score for the purpose of comparing data across years. • Comparison cannot occur using raw scores because of difference in test item difficulty. • The scale selected for all NeSA tests is 0-200. • Raw scores and scale scores should not be compared across content areas.
PERFORMANCE LEVELS - three possible categories of student performance on NeSA ~NeSA Terminology~
How are performance levels determined? • Cut score processes: • Contrasting Group Method – 400+ teachers • Bookmark Method – 100+ teachers • State Board of Education Reviewed • Examined results of both processes • Examined NAEP and ACT results for Nebraska • Made decisions within recommended range at public meeting
SCALE SCORE – a student’s transformed version of the raw score earned on NeSA ~NeSA Terminology~
RAW SCORE – the number of items a student answers ‘right’ on NeSA-R on NeSA Reports on Conversion Chart ~NeSA Terminology~
On score reports why is the . . . SCALE SCORE CONVERTED TO PERCENTILE RANK? The percentile rank was placed on the score reports because our Technical Advisory Committee felt that parents would want to know their child’s position in relation to other test takers. A percentile rank of 84 means the child scored better than 84% of the students who took the test that year. ~NeSA Terminology~
Use the Reports Interpretive Guide! http://www.education.ne.gov/Assessment/documents/NESA.Read.InterpretiveGuide.pdf
Where do we find important information regarding NeSA? www.education.ne.gov/Assessment * “Leadership in Using NeSA Data” PowerPoint
Need Assistance? • Contact your ESU Professional • Development Department
NEBRASKA STATE ACCOUNTABILITY Understanding NeSA Raw Scores & Scale Scores 2010-2011 ESU 8