Download

1 / 20
200 likes | 222 Views
This article explores the concepts of hypothesis testing, distribution of sample means, and inferential statistics in psychology. It covers topics such as standard error, central limit theorem, hypothesis testing steps, error types, and reaching conclusions. Relevant for anyone studying or working in psychology.

E N D
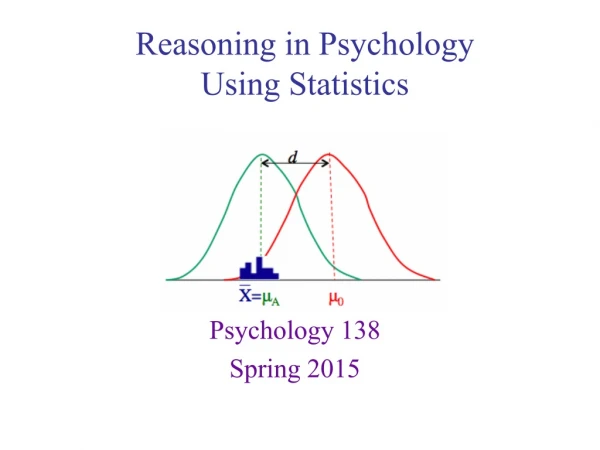
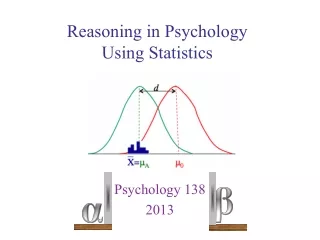
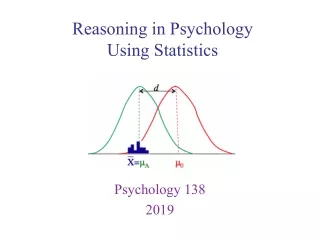
Reasoning in PsychologyUsing Statistics Psychology 138 2017
Distribution of sample means • Standard error • Central limit theorem • Hypothesis testing • 5 step program • Hypotheses • Null and Alternative • 1 or 2 tailed • Error types • p(Type I error) = α alpha • p(Type II error) = β beta • Reaching a conclusion • Reject the H0 • Fail to reject H0 • Test statistics • 1-sample z • 1-sample t • Related sample t • Independent sample t Exam 3 review: Inferential Statistics
Sampling to make data collection manageable Inferential statistics used to generalize back Population Sample • Hypothesis testing • Testing claims about populations (and the effect of variables) based on data collected from samples • Using estimates of the sampling error (expected difference between the sample statistics and the population parameters) Inferential statistics
Hypothesis testing • Testing claims about populations (and the effect of variables) based on data collected from samples • Using estimates of the sampling error (expected difference between the sample statistics and the population parameters) A five step program • Step 1: State your hypotheses • Step 2: Set your decision criteria • Step 3: Collect your data from your sample • Step 4: Compute your test statistics • Step 5: Make a decision about your null hypothesis Testing Hypotheses
Concluding that there is a difference between groups (“an effect”) when there really isn’t Concluding that there isn’t an effect, when there really is Real world (‘truth’) H0 is correct H0 is wrong Type I error Reject H0 Experimenter’s conclusions Fail to Reject H0 Type II error Error types
Central Limit Theorem X • For any population with mean μ and standard deviation σ, the distribution of sample means for sample size n will approach a normal distribution with a mean of μ and a standard deviation of as n approaches infinity Population Distribution of sample means Sample (good approximation if n > 30). σ s μ Properties of the distribution of sample means
Central Limit Theorem • For any population with mean μ and standard deviation σ, the distribution of sample means for sample size n will approach a normal distribution with a mean of μ and a standard deviation of as n approaches infinity Distribution of sample means (good approximation if n > 30). Standard error: the average amount a sample mean (of a particular sample size) will differ from the population mean. Used as our difference expected by chance in our test statistics. Properties of the distribution of sample means
“Generic” test statistic Could be difference between a sample and a population, or between different samples Standard error: the average amount a sample mean (of a particular sample size) will differ from the population mean. Used as our difference expected by chance in our test statistics. Properties of the distribution of sample means
Use the decision tree • Will you use z’s or t’s? • If two samples, are they independent or related? • Analyze the question/problem. • The design of the research: how many groups, how many scores per person, is the population σ known, etc. • Write out what information is given • Means, standard deviations, number of subjects, α-level, etc. • Is it asking you to test a difference or make an estimate? • If hypothesis test: • What are the H0 and HA? • 1-tailed or 2-tailed hypotheses? • What is your critical value of your test statistic (z or t from table, you will need your α-level, and df, and 1-or-2 tailed) Performing your inferential statistics
Test statistic, (estimated) standard error, standard deviation, SS, mean, degrees of freedom • Then fill in the numbers as you know them • Analyze the question/problem. • Now you are ready to do some computations • Write out all of the formulas that you will need Performing your inferential statistics
Distribution of the t-statistic or z-statistic The α-level defines the critical regions • Analyze the question/problem. • Now you are ready to do some computations • Draw a Conclusion and Interpret your final answer • Reject or fail to reject the null hypothesis? Performing your inferential statistics
If the observed test statistic is here Reject H0 If the observed test statistic is here Fail to reject H0 • Analyze the question/problem. • Now you are ready to do some computations • Draw a Conclusion and Interpret your final answer • Reject or fail to reject the null hypothesis? Distribution of the t-statistic or z-statistic “Evidence suggests that the treatment has an effect” “Evidence suggests that the treatment has no effect” Performing your inferential statistics
tcrit = +1.86 • Drawing your conclusions: Using the t-table • Suppose that you conduct a one sample t-test and get a computed t = -4.899 (with a df = 8). Using a 2-tailed test with an α-level of 0.05, what would you conclude? α = 0.05 2-tailed df = n - 1 = 8 “Reject H0” t = -4.899 The t-distribution
tcrit = +1.86 • Drawing your conclusions: Using the SPSS output • Suppose that you conduct a one sample t-test and get a computed t = -4.899 (with a df = 8). Using a 2-tailed test with an α-level of 0.05, what would you conclude? α = 0.05 2-tailed df = n - 1 = 8 “Reject H0” t = -4.899 , which is within the .05 defined by α 0.001 area in the tail Can compare the p-value and the alpha level t-value large enough, p < α(e.g., .05) Reject H0 t-value too small, p > α(e.g., .05) Fail to reject H0 The t-distribution
(Estimated) Standard error df Design Test statistic One sample, σ known One sample, σ unknown Two related samples, σ unknown Two independent samples, σ unknown Hypothesis testing formulas summary
The usual: • Review lecture notes and labs • Re-read the Reading packet • Do practice problems • Remember to ask yourself “conceptual questions” • e.g., “What would happen to my standard error if I increased my sample size?” • Make Flash Cards of problems How do I study for this test?
Side 1: Write out the problem H0: μA = μB HA: μA ≠ μB α-level =0.05 Side 2: Write out the solution • Dr. Mnemonic develops a new treatment for patients with a memory disorder. He isn’t certain what impact, if any, it will have. To test it he randomly assigns 8 patients to one of two samples. He then gives one sample (A) the new treatment but not the other (B) and then tests both groups with a memory test. Use α = 0.05. Independent samples t-test Two tailed “any impact” Fail to Reject H0 Evidence suggests that the treatment has no effect Make your flash cards
Dr. Ruthie asked each member of 10 married couples with children to rate the importance of “nights out” (1=not important, 5= very important). Dr. Ruthie hypothesized that wives would consider the nights out more important than the husbands. Test her hypothesis with a probability of making a type I error = 0.05. Related samples t-test Husbands: 5, 3, 4, 2, 3, 4, 5, 1, 1, 4 Wives: 5, 4, 5, 3, 2, 4, 5, 2, 3, 4 One tailed “more important” H0: μD > 0 HA: μD< 0 α-level =0.05 Reject H0 Evidence suggests that wives do care more Make your flash cards
One sample t-test Two tailed “different than” H0: μ = 20 HA: μ ≠ 20 α-level =0.01 Reject H0 Evidence suggests that performed differently from chance • Dr. Psychic examined the performance of 28 students who answered multiple-choice items on the SAT test without having read the passages to which the items referred. The mean score was 46.6 (out of 100), with a standard deviation of 6.8. Test whether these students performed different than chance (chance performance would result in 20 correct scores) with an α-level = 0.01. Make your flash cards
Practice determining which statistical test is appropriate for a number of different situations, and carrying out that test (practice by hand and using SPSS). In labs