Download

1 / 64
640 likes | 667 Views
Explore the process of hypothesis testing in psychology using statistical methods. Learn about null and alternative hypotheses, the five-step program, alpha level, distribution of sample means, and more. Understand the properties of the distribution of sample means and how it relates to population characteristics. Discover the Central Limit Theorem and the importance of standard error in statistical analysis. Gain insights into how to choose the right statistical test based on your research design.

E N D
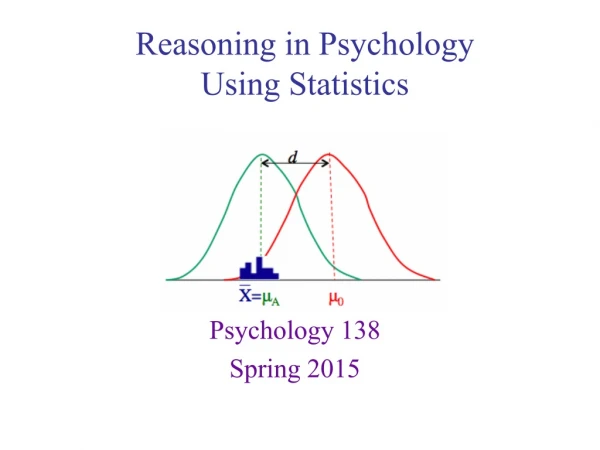
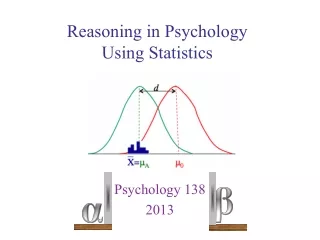
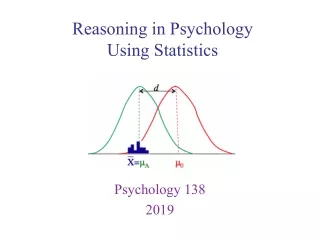
Reasoning in PsychologyUsing Statistics Psychology 138 2018
Moved the due date for Quiz 5. Now it is due Tue. Mar. 27 at midnight Announcements
Hypothesis testing: a five step program H0 Null Hypothesis HA Alternative Hypothesis • Step 1: State your hypotheses • Step 2: Set your decision criteria • Step 3: Collect your data from your sample • Step 4: Compute your test statistics • Step 5: Make a decision about your null hypothesis ⍺ Alpha level Distribution of Sample Means Note: In the labs I combine steps 1 & 2, so it is described as a 4 step program • Statistics How To: Hypotheses (~4 mins) • StatsLectures: Hypotheses and Error types (~4 mins) • Hypothesis testing and Error types (~7 mins) Testing Hypotheses
The distribution of sample means (DSM) 5 4 3 2 2 4 6 8 1 2 3 4 5 6 7 8 means In long run, the random selection of tiles leads to a predictable pattern mean mean mean 2 2 2 4 6 5 8 2 5 2 4 3 4 8 6 8 4 6 2 6 4 6 2 4 8 6 7 2 8 5 6 4 5 8 8 8 4 2 3 6 6 6 4 4 4 6 8 7 All 16 samples of n=2 from Population: Distribution of sample means
Population Sample Distribution of sample means • Distribution of sample means is a “virtual” distribution between the sample and population • Note: There is a different one for each sample size • Shape • Center • Spread Distribution of sample means
Distribution of sample means Population n > 30 • If the sample size is large (n > 30), the DSM will be approximately Normal (regardless of shape of the population) • Shape • If population is Normal, then the dist of sample means will be Normal Properties of the distribution of sample means
Distribution of sample means same numeric value different conceptual values • Center • The mean of the dist of sample means is equal to the mean of the population Population Properties of the distribution of sample means
5 4 3 2 1 2 3 4 5 6 7 8 means Population Distribution of sample means 2 4 6 8 2 + 4 + 6 + 8 4 2+3+4+5+3+4+5+6+4+5+6+7+5+6+7+8 = 16 • Center • The mean of the dist of sample means is equal to the mean of the population • Consider our earlier example μ = = 5 = 5 Properties of the distribution of sample means
The Stand. Dev. of the Distrib. of Sample Mean depends on 2 things • Spread • Standard deviation of the population • Sample size Properties of the distribution of sample means
X X 2 2 X X X 3 1 1 X 3 μ μ • Spread • Standard deviation of the population • The smaller the population variability, the closer the sample means are to the population mean, so the smaller the spread of sample means Properties of the distribution of sample means
X μ • Spread • Standard deviation of the population n = 1 • Sample size Properties of the distribution of sample means
X μ • Spread • Standard deviation of the population • Sample size n = 10 Properties of the distribution of sample means
X μ • Spread • Standard deviation of the population n = 100 • Sample size - The larger the sample size the smaller the spread of sample means Properties of the distribution of sample means
- The smaller the population variability, the smaller the spread - The larger the sample size the smaller the spread • Spread • Standard deviation of the population • Sample size • Putting them together we get the standard deviation of the distribution of sample means • Commonly called the standard error Properties of the distribution of sample means
For any population with mean μ and standard deviation σ, the distribution of sample means for sample size n will approach a normal distribution with a mean of μ and a standard deviation of as n approaches infinity (good approximation if n > 30). MEMORIZE THIS • All three of these properties are combined to form the Central Limit Theorem Properties of the distribution of sample means Central Limit Theorem (~13 mins)
Keep your distributions straight by taking care with your notation Distribution of sample means X Population Sample σ s μ • The standard error is the average amount that you’d expect a sample (of size n) to deviate from the population mean • In other words, it is an estimate of the error that you’d expect by chance (it is our estimate of the sampling error) Properties of the distribution of sample means
Hypothesis testing: a five step program • Step 1: State your hypotheses • Step 2: Set your decision criteria • Step 3: Collect your data from your sample • Step 4: Compute your test statistics • Step 5: Make a decision about your null hypothesis Testing Hypotheses
Start here • How do we know which test to use? • The design of the research: how many groups, how many scores per person, etc. Statistical test decision tree
Could be difference between a sample and a population, or between different samples Both of these parts change as a function of the design As a result, the test statistic changes Based on standard error or an estimate of the standard error • How do we know which test to use? • The design of the research: how many groups, how many scores per person, etc. Generic statistical test
Distribution of sample means Test statistic distribution Test statistic • Transform the distribution of sample means into the appropriate standardized distribution (as determined by the design features) We will use 2: z’s & t’s Using the distribution of sample means
Old z-formula New z-formula • Same as before, with two differences: • Uses the distribution of sample means • Ask questions about samples rather than individual scores One sample z-test statistic
Old z-formula New z-formula • Same as before, with two differences: • Uses the distribution of sample means • Ask questions about samples rather than individual scores One sample z-test statistic
mean of the distribution of sample means population mean sample mean raw score population standard deviation standard error New z-formula Old z-formula One sample z-test statistic
Old z-formula New z-formula • Same as before, with two differences: • Uses the distribution of sample means • Ask questions about samples rather than individual scores One sample z-test statistic
Old z-formula What is the probability of getting a 630 or better on the SAT? New z-formula What is the probability of getting a sample of n = 4 students with an average of 630 or better on the SAT? So the probability is 0.0047 So the probability is 0.0968 μ = 500, σ = 100, Normal From the table: z(1.3) =.0968 μ = 500, σ = 100, Normal From the table: z(2.6) =.0047 One sample z-test statistic
Hypothesis testing: a five step program • Step 1: State your hypotheses • Step 2: Set your decision criteria • Step 3: Collect your data from your sample • Step 4: Compute your test statistics • Step 5: Make a decision about your null hypothesis Testing Hypotheses
Population of memory patients Conclusions: • The memory treatment sample are the same as those in the population of memory patients. • They aren’t the same as those in the population of memory patients We test this one Memory Test X H0: MemoryTest μ & σ known Memory patients Memory treatment HA: Compare these two means • What are we doing when we test the hypotheses? • Consider a variation of our memory experiment example Performing your statistical test
One population Two populations We test this one The memory treatment sample are the same as those in the population of memory patients. They aren’t the same as those in the population of memory patients XA XA Real world (‘truth’) H0: is true (no treatment effect) H0: is false (is a treatment effect) • What are we doing when we test the hypotheses? Performing your statistical test
Distribution of the test statistic • The generic test statistic distribution (a transformation of the distribution of sample means) • To reject the H0, you want a computed test statistics that is large • The probability of having a sample with that mean is very low • What’s large enough? • The alpha level gives us the decision criterion α-level determines where these boundaries go “Generic” statistical test
Distribution of the test statistic If test statistic is here Reject H0 If test statistic is here Fail to reject H0 • The generic test statistic distribution (a transformation of the distribution of sample means) • To reject the H0, you want a computed test statistics that is large • The probability of having a sample with that mean is very low • What’s large enough? • The alpha level gives us the decision criterion “Generic” statistical test
Reject H0 α = 0.05 0.025 split up into the two tails 0.025 Fail to reject H0 Two -tailed • The alpha level gives us the decision criterion • Go to the table (unit normal table for z-test) and find the z that has 0.050 in the tails. Zcritical = ±1.96 “Generic” statistical test
Reject H0 0.05 all of it in one tail α = 0.05 Fail to reject H0 Two -tailed One -tailed Reject H0 • The alpha level gives us the decision criterion Reject H0 Fail to reject H0 Fail to reject H0 • Go to the table (unit normal table for z-test) and find the z that has 0.050 in the tail. Zcritical = +1.645 “Generic” statistical test
Reject H0 α = 0.05 0.05 Fail to reject H0 Two -tailed One -tailed all of it in one tail Reject H0 • The alpha level gives us the decision criterion Reject H0 Fail to reject H0 Fail to reject H0 • Go to the table (unit normal table for z-test) and find the z that has 0.050 in the tail. Zcritical = -1.645 “Generic” statistical test
Dr. Mnemonic develops a new treatment for patients with a memory disorder. He hypothesizes that the treatment will improve memory performance. To test it he collects a sample of 16 patients and gives them his new treatment. Following the treatment he gives them a standard memory test. His sample averaged 55 errors (while the typical memory patient averages μ = 60 errors, with σ = 8). Test using α = 0.05. Population of memory patients Memory Test σ is known μ is known Memory Test X Memory patients Memory treatment Compare these two means 1-sample z-test
1 sample • Dr. Mnemonic develops a new treatment for patients with a memory disorder. He hypothesizes that the treatment will improve memory performance. To test it he collects a sample of 16 patients and gives them his new treatment. Following the treatment he gives them a standard memory test. His sample averaged 55 errors (while the typical memory patient averages μ = 60 errors, with σ = 8). Test using α = 0.05. Population of memory patients Memory Test σ is known μ is known Memory Test X Memory patients Memory treatment Compare these two means 1-sample z-test
1 sample • Dr. Mnemonic develops a new treatment for patients with a memory disorder. He hypothesizes that the treatment will improve memory performance. To test it he collects a sample of 16 patients and gives them his new treatment. Following the treatment he gives them a standard memory test. His sample averaged 55 errors (while the typical memory patient averages μ = 60 errors, with σ = 8). Test using α = 0.05. Population of memory patients Memory Test σ is known μ is known Memory Test X Memory patients Memory treatment Compare these two means • 1 score per subject 1-sample z-test
1 sample 1-sample z-test • Dr. Mnemonic develops a new treatment for patients with a memory disorder. He hypothesizes that the treatment will improve memory performance. To test it he collects a sample of 16 patients and gives them his new treatment. Following the treatment he gives them a standard memory test. His sample averaged 55 errors (while the typical memory patient averages μ = 60 errors, with σ = 8). Test using α = 0.05. Population of memory patients Memory Test σ is known μ is known Memory Test X Memory patients Memory treatment Compare these two means • 1 score per subject • Population mean (μ) and standard deviation (σ) are known (assume Normal dist) 1-sample z-test
Dr. Mnemonic develops a new treatment for patients with a memory disorder. He hypothesizes that the treatment will improve memory performance. To test it he collects a sample of 16 patients and gives them his new treatment. Following the treatment he gives them a standard memory test. His sample averaged 55 errors (while the typical memory patient averages μ = 60 errors, with σ = 8). Test using α = 0.05. One -tailed H0: the memory treatment sample are the same as those in the population of memory patients (or even worse). HA: the memory treatment sample perform better (fewer errors) than those in the population of memory patients • Step 1: State your hypotheses μTreatment > μpop = 60 • Step 2: Set your decision criteria • Step 3: Collect your data • Step 4: Compute your test statistics μTreatment < μpop = 60 • Step 5: Make a decision about your null hypothesis Performing your statistical test
Dr. Mnemonic develops a new treatment for patients with a memory disorder. He hypothesizes that the treatment will improve memory performance. To test it he collects a sample of 16 patients and gives them his new treatment. Following the treatment he gives them a standard memory test. His sample averaged 55 errors (while the typical memory patient averages μ = 60 errors, with σ = 8). Test using α = 0.05. μTreatment > μpop = 60 H0: α = 0.05 μTreatment < μpop = 60 HA: One -tailed • Step 1: State your hypotheses • Step 2: Set your decision criteria • Step 3: Collect your data • Step 4: Compute your test statistics • Step 5: Make a decision about your null hypothesis Performing your statistical test
Dr. Mnemonic develops a new treatment for patients with a memory disorder. He hypothesizes that the treatment will improve memory performance. To test it he collects a sample of 16 patients and gives them his new treatment. Following the treatment he gives them a standard memory test. His sample averaged 55 errors (while the typical memory patient averages 60 errors, with a σ = 8). Test using α = 0.05. μTreatment > μpop = 60 H0: n = 16, X = 55 μTreatment < μpop = 60 HA: One -tailed α = 0.05 • Step 1: State your hypotheses • Step 2: Set your decision criteria • Step 3: Collect your data • Step 4: Compute your test statistics • Step 5: Make a decision about your null hypothesis Performing your statistical test
Dr. Mnemonic develops a new treatment for patients with a memory disorder. He hypothesizes that the treatment will improve memory performance. To test it he collects a sample of 16 patients and gives them his new treatment. Following the treatment he gives them a standard memory test. His sample averaged 55 errors (while the typical memory patient averages 60 errors, with a σ = 8). Test using α = 0.05. μTreatment > μpop = 60 H0: n = 16, X = 55 μTreatment < μpop = 60 HA: One -tailed α = 0.05 • Step 1: State your hypotheses = -2.5 • Step 2: Set your decision criteria • Step 3: Collect your data • Step 4: Compute your test statistics • Step 5: Make a decision about your null hypothesis Performing your statistical test
Dr. Mnemonic develops a new treatment for patients with a memory disorder. He hypothesizes that the treatment will improve memory performance. To test it he collects a sample of 16 patients and gives them his new treatment. Following the treatment he gives them a standard memory test. His sample averaged 55 errors (while the typical memory patient averages 60 errors, with a σ = 8). Test using α = 0.05. μTreatment > μpop = 60 H0: n = 16, X = 55 μTreatment < μpop = 60 HA: 5% One -tailed α = 0.05 • Step 1: State your hypotheses = -2.5 • Step 2: Set your decision criteria • Step 3: Collect your data • Step 4: Compute your test statistics • Step 5: Make a decision about your null hypothesis Reject H0 - Support for our HA, the evidence suggests that the treatment decreases the number of memory errors Performing your statistical test
If time allows: The following pages give examples of situations that require different statistical tests. Performing your statistical test
Dr. Mnemonic develops a new treatment for patients with a memory disorder. He isn’t certain what impact, if any, it will have. To test it he collects a sample of 25 patients and gives them his new treatment. Following the treatment he gives them a standard memory test. His sample averaged 55 errors, with a s = 8 (while the typical memory patient averages 60 errors). Population of memory patients MemoryTest is NOT known • is known Memory Test X Memory patients Memory treatment Compare these two means Hypotheses: • the memory treatment sample are the same as those in the population of memory patients. • they aren’t the same as those in the population of memory patients H0: HA: Performing your statistical test
Dr. Mnemonic develops a new treatment for patients with a memory disorder. He isn’t certain what impact, if any, it will have. To test it he collects a sample of 25 patients and gives them his new treatment. Following the treatment he gives them a standard memory test. His sample averaged 55 errors, with a s = 8 (while the typical memory patient averages 60 errors). Population of memory patients MemoryTest is NOT known • is known Memory Test X Memory patients Memory treatment Compare these two means • 1 sample Hypotheses: • the memory treatment sample are the same as those in the population of memory patients. • they aren’t the same as those in the population of memory patients H0: HA: Performing your statistical test
Dr. Mnemonic develops a new treatment for patients with a memory disorder. He isn’t certain what impact, if any, it will have. To test it he collects a sample of 25 patients and gives them his new treatment. Following the treatment he gives them a standard memory test. His sample averaged 55 errors, with a s = 8 (while the typical memory patient averages 60 errors). Population of memory patients MemoryTest is NOT known • is known Memory Test X Memory patients Memory treatment Compare these two means • 1 sample • One score per subject Hypotheses: • the memory treatment sample are the same as those in the population of memory patients. • they aren’t the same as those in the population of memory patients H0: HA: Performing your statistical test
Dr. Mnemonic develops a new treatment for patients with a memory disorder. He isn’t certain what impact, if any, it will have. To test it he collects a sample of 25 patients and gives them his new treatment. Following the treatment he gives them a standard memory test. His sample averaged 55 errors, with a s = 8 (while the typical memory patient averages 60 errors). Population of memory patients MemoryTest is NOT known • is known Memory Test X Memory patients Memory treatment Compare these two means • 1 sample • One score per subject • Population mean (μ) is known Hypotheses: • the memory treatment sample are the same as those in the population of memory patients. • they aren’t the same as those in the population of memory patients H0: HA: Performing your statistical test
Dr. Mnemonic develops a new treatment for patients with a memory disorder. He isn’t certain what impact, if any, it will have. To test it he collects a sample of 25 patients and gives them his new treatment. Following the treatment he gives them a standard memory test. His sample averaged 55 errors, with a s = 8 (while the typical memory patient averages 60 errors). Population of memory patients MemoryTest is NOT known • is known Memory Test X Memory patients Memory treatment Compare these two means • 1 sample • One score per subject • Population mean (μ) is known • Population standard deviation (s) is NOT known Hypotheses: • the memory treatment sample are the same as those in the population of memory patients. • they aren’t the same as those in the population of memory patients H0: HA: Performing your statistical test
The single sample t-test can be used when: • 1 sample • One score per subject • Population standard deviation (s) is NOT known • Population mean (m) is known Which test do we use?
Dr. Mnemonic develops a new treatment for patients with a memory disorder. He isn’t certain what impact, if any, it will have. To test it he collects a sample of 25 patients and gives them his new treatment. Before the treatment he gives them a pre-treatment memory test and after the treatment a post-treatment memory test. His sample averaged 60 errors before the treatment and 55 errors after the treatment. Pre-test Post-test Memory Test X Memory Test X Memory treatment Compare these two means H0: Memory performance at the post-test is equal to memory performance at the pre-test. HA: Memory performance at the post-test is NOT equal to memory performance at the pre-test Memory patients Hypotheses: Performing your statistical test