Download

1 / 23
230 likes | 250 Views
This quiz explores reasoning in psychology using statistics, covering topics like hypothesis testing, correlation, regression, chi-squared test, and more. You will analyze data to draw conclusions and make estimations using inferential statistics. Understand different statistical procedures, interpretations, and testing methods to make informed decisions in psychological research. Improve your knowledge of population parameters and sample statistics. Lab Exam 4 focuses on drawing conclusions from data analysis, designing research tests, and making estimates based on given information. Learn how to choose the right statistical test and interpret the results effectively for the best psychological analysis.

E N D
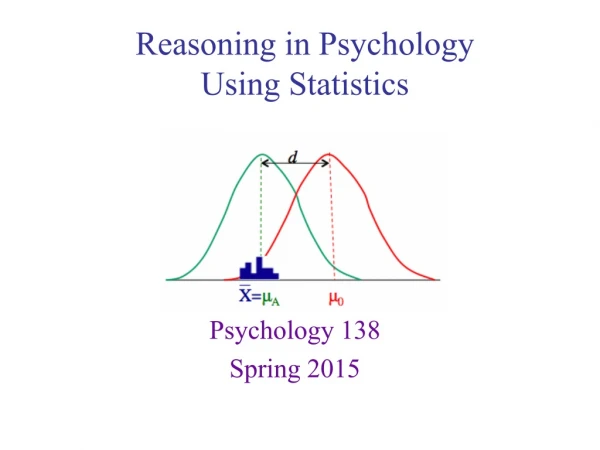
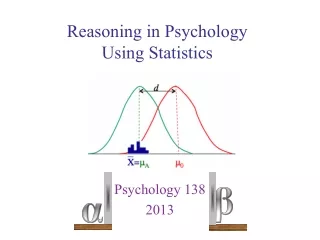
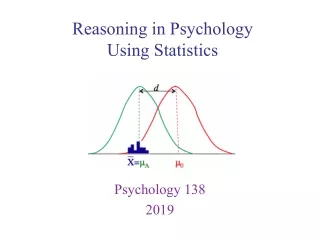
Reasoning in PsychologyUsing Statistics Psychology 138 2017
Quiz 10, due Friday May 5th. You may take it up to 10 times, your top score is what counts.
Inferential Statistics: Procedures which allow us to make claims about the population based on sample data • Hypothesis testing • Correlation • Regression • Chi-squared test • Estimation • Point estimates • Confidence intervals • 1-sample z test • 1-sample t test • Related samples t-test • Independent samples t-test • Testing claims about populations (based on data collected from samples) • Using sample statistics to estimate the population parameters Lab Exam 4: Conclusions from Data
Analyze the question/problem. • The design of the research: how many groups, how many scores per person, is the population σ known, etc. • Write out what information is given • Is it asking you to test a difference, test a relationship, or make an estimate? • What is your critical value of your test statistic (z or t from table, you’ll need your α-level) • Now you are ready to do some computations • Write out all of the formulas that you’ll need • Then fill in the numbers as you know them • Interpret your final answer • Reject or fail to reject the null hypothesis? What does that mean? • State your confidence interval and what it means Performing your inferential statistics
The design determines the test Which test do I use?
Y SSY = 16.0 df = n - 2 SSX = 15.20 = 5 - 2 =3 SP = 14.0 rcrit = 0.878 6 5 H0: ρ =0 3 4 2 HA: ρ ≠ 0 1 X 1 2 3 4 5 6 Suppose that you notice that the more you study for an exam (X= hours of study), the better your exam score typically is (Y = exam score).Test if there is a significant correlation between the two variables (α = 0.05) A 6 6 B 1 2 C 5 6 D 3 4 E 3 2 Correlation 2-tailed Reject H0 There is a significant positive correlation between study time and exam performance Correlation within hypothesis testing
The design determines the test Which test do I use?
Y 6 5 4 3 2 1 1 2 3 4 5 6 X • The “best fitting line” is the one that minimizes the differences (error or residuals) between the predicted scores (the line) and the actual scores (the points) • Directly compute the equation for the best fitting line • Slope • Intercept • Also need a measure of error: • r2 (r-squared) • Sum of the squared residuals = SSresidual= SSerror • Standard error of estimate Regression
Y 6 5 3 4 2 Hypothesis testing on each of these 1 X 1 2 3 4 5 6 Suppose that you notice that the more you study for an exam (X= hours of study), the better your exam score typically is (Y = exam score).Compute the regression equation predicting exam score with study time. A 6 6 B 1 2 C 5 6 D 3 4 E 3 2 SSY = 16.0 Bi-variate regression SSX = 15.20 SP = 14.0 r2 = 0.806 Prediction with Bi-variate regression
Measures of Error • r2 • Standard error of the estimate • Unstandardized coefficients • “(Constant)” = intercept • Variable name = slope • These t-tests test hypotheses • H0: Intercept (constant) = 0 • H0: Slope = 0 • SPSS Regression output gives you a lot of stuff Hypothesis testing with Regression
The design determines the test Which test do I use?
When do we use these methods? • When we have categorical variables Step 1: State the hypotheses and select an alpha level Step 2: Compute your degrees of freedom df = (#Cols-1)*(#Rows-1) & Go to Chi-square statistic table and find the critical value Step 3: Obtain row and column totals and calculate the expected frequencies Step 4: compute the χ2 Step 5: Compare the computed statistic against the critical value and make a decision about your hypotheses Crosstabulation and χ2
Inferential Statistics: Procedures which allow us to make claims about the population based on sample data • Hypothesis testing • Correlation • Regression • Chi-squared test • Estimation • Point estimates • Confidence intervals • 1-sample z test • 1-sample t test • Related samples t-test • Independent samples t-test • Testing claims about populations (based on data collected from samples) • Using sample statistics to estimate the population parameters Lab Exam 4: Conclusions from Data
Age hours of studying per week hours of sleep per night pizza consumption • Describe the typical college student • Point estimates “12 hrs” • Interval estimates “2 to 21 hrs” “19 yrs” “17 to 21 yrs” “8 hrs” “1 per wk” “4 to 10 hrs” “0 to 8 per wk” Estimation of population parameters
Margin of error • Both kinds of estimates use the same basic procedure • Finding the right test statistic (z or t) • You begin by making a reasonable estimation of what the z (or t) value should be for your estimate. • For a point estimation, you want what? z (or t) = 0, right in the middle • For an interval, your values will depend on how confident you want to be in your estimate • Computing the point estimate orthe confidence interval: • Step 1: Take your “reasonable” estimate for your test statistic • Step 2: Put it into the formula • Step 3: Solve for the unknown population parameter Estimation
Sample size • As n decreases, the margin of error gets wider(changes the standard error) • Level of confidence • As confidence decreases (e.g., 95%-> 90%), the margin of error gets narrower (changes the critical test statistic values) • The size of the margin of error related to: Estimation
Make an interval estimate with 90% confidence of the population mean given a sample with a X = 85, n = 25, and a population σ = 5. Make an interval estimate with 95% confidence of the population mean given a sample with a X = 85, n = 25, and a population σ = 5. Make an interval estimate with 90% confidence of the population mean given a sample with a X = 85, n = 4, and a population σ = 5. All centered on 85 83 89 81 85 87 or 85 ± 1.96 86.96 83.04 narrower 86.65 83.35 or 85 ± 1.65 wider 89.13 80.88 or 85 ± 4.13 Estimates with z-scores
The design determines the formula that you’ll use for the estimation Which test do I use?
The design determines the formula that you’ll use for the estimation Design Estimation (Estimated) Standard error One sample, σ known One sample, σ unknown Two related samples, σ unknown Two independent samples, σ unknown Estimation Summary
Make an interval estimate with 95% confidence of the population mean given a sample with a X = 85, n = 25, and a population σ = 5. From the table: • z(1.96) =.0250 2.5% 2.5% 95% What two z-scores do 95% of the data lie between? So the 95% confidence interval is: 83.04 to 86.96 or 85 ± 1.96 Estimates with z-scores
Make an interval estimate with 95% confidence of the population mean given a sample with a X = 85, n = 25, and a sample s = 5. 2.5% 2.5% 95% What two critical t-scores do 95% of the data lie between? So the confidence interval is: 82.94 to 87.06 • From the table: • tcrit =+2.064 or 85 ± 2.064 Estimation in one sample t-design
Dr. S. Beach reported on the effectiveness of cognitive-behavioral therapy as a treatment for anorexia. He examined 12 patients, weighing each of them before and after the treatment. Estimate the average population weight gain for those undergoing the treatment with 90% confidence. Differences (post treatment - pre treatment weights): 10, 6, 3, 23, 18, 17, 0, 4, 21, 10, -2, 10 Related samples estimation Confidence level 90% CI(90%)= 5.72 to 14.28 Estimation in related samples design
Dr. Mnemonic develops a new treatment for patients with a memory disorder. He randomly assigns 8 patients to one of two samples. He then gives one sample (A) the new treatment but not the other (B) and then tests both groups with a memory test. Estimate the population difference between the two groups with 95% confidence. Independent samples t-test situation Confidence level 95% CI(95%)= -8.73to 19.73 Estimation in independent samples design