Download
1 / 27
270 likes | 292 Views
Analyzing parametric and semiparametric regression models for inland railway passenger conveyances in Latvian regions. Comparing linear regression and single index model, estimating coefficients, model testing, and result analysis.

E N D
Single Index Model for Railway Passenger Conveyances Forecasting in Regions of Latvia Diana Santalova Riga Technical University The 8th Tartu Conference on Multivariate Statistics
OUTLINE • PROBLEM OF RESEARCH • USED REGRESSION MODELS • ESTIMATION OF THE SINGLE INDEX MODEL • THE MODELS FOR FORECASTING OF CONVEYANCES • MODELS TESTING AND ANALYSIS OF RESULTS • CONCLUSIONS • REFERENCES The 8th Tartu Conference on Multivariate Statistics
1. PROBLEM OF RESEARCH Comparative analysis of parametric and semiparametric regression group models on the basis of forecasting of inland railwaypassenger conveyances for regions of Latvia The 8th Tartu Conference on Multivariate Statistics
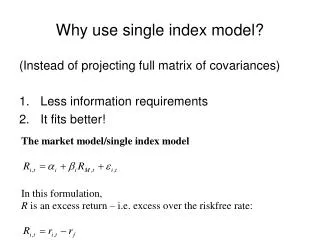
2. USED REGRESSION MODELS Parametric linear regression model: m(xi) = 0 + 1xi,1 + 2xi,2 + … + dxi,d = Txi,(1) where T = (01 … d) is a vector of unknown coefficients; xi = (1 xi,1 … xi,d )Tis a vector of values of independent variables in i-th observation. The 8th Tartu Conference on Multivariate Statistics
Single Index regression model[Härdle et al. 2004]: m(xi) = g(0 + 1xi,1 + 2xi,2 + … + dxi,d)= g(Txi), (2) where g() is an unknown link function of the one-dimensional variable; τi = Txiis called an index. The main assumption: the unknown function m(x) is a smooth function. The 8th Tartu Conference on Multivariate Statistics
3. ESTIMATION OF THE SINGLE INDEX MODEL As g() function the kernel function usually is considered. We need to estimate the unknown coefficients vector β and the link function g(). For the latter, the Nadaraya-Watson kernel estimator can be applied: (3) where is the value of index for the i-th observation, Yi is the value of dependent variable for the i-th observation and is kernel function. The 8th Tartu Conference on Multivariate Statistics
As the Gaussian function is used: (4) where h is a bandwidth. The 8th Tartu Conference on Multivariate Statistics
x x 2h1 2h2 The 8th Tartu Conference on Multivariate Statistics
The unknown coefficients vector β is estimated by use of the least squares criterion: Minimum of criteria is found by means of the gradient method. (5) The 8th Tartu Conference on Multivariate Statistics
For this purpose the corresponding gradient w.r.t. theunknown coefficients was found: (6) The 8th Tartu Conference on Multivariate Statistics
(7) where and (8) is the first order derivative of the Gaussian kernel. The 8th Tartu Conference on Multivariate Statistics
We are able to compare single index models by the residual sum of squares RSS only. We calculate the residual sum of squares as follow: (9) The 8th Tartu Conference on Multivariate Statistics
4. THE MODELS FOR FORECASTING OF CONVEYANCES • The suggested models are group models • All the needed data have been obtained from the Latvijas dzelzceļš 2003 report and Statistical Yearbook of Latvia 2003 • The 19 regions of Latvia were selected • The considered period is from 2000 to 2003 • The forecasted variable is the inland rail passenger conveyances, expressed in thousands of passengers The 8th Tartu Conference on Multivariate Statistics
Explanatory factors are: x1– the population density; x2– the number of enterprises per a unit of territory; x3 – the number of enterprises per 1000 residents; x4 – the density of the unemployed population; x5 – the number of schools per a unit of territory; x6 – the number of buses per a unit of territory; x7 – the number of buses per 1000 residents; x8 – the number of railway stations. The 8th Tartu Conference on Multivariate Statistics
The first model is the linear regression model (2) and the second model is the single index model (3). The dependent variables Y(1) in linear model and Y(2) in SIM are inland rail passenger conveyances. Explanatory variables are all eight mentioned above. • Our task is to estimate the unknown coefficients for the models, to compare the suggested models and to prove the preference of semiparametric model. The 8th Tartu Conference on Multivariate Statistics
5. ANALYSIS OF RESULTS Criteria: • Residual Sum of Squares RSS (9) • Multiple determination coefficient R2 • Fisher criterion • Student criterion Approaches: • Smoothing • Cross-validation The 8th Tartu Conference on Multivariate Statistics
5.1. SMOOTHING. LINEAR MODEL ESTIMATION (10) RSS = 42 430 R2 = 0.48 Calculated Fisher criterion is 16.58 F(5, 89) = 2.32 α = 5% The 8th Tartu Conference on Multivariate Statistics
5.2. SMOOTHING. SIM ESTIMATION The best chosen single index model with h0 = 0.5 and RSS = 8 877 can be written as: (11) The 8th Tartu Conference on Multivariate Statistics
5.3. CROSS-VALIDATION. LINEAR MODEL ESTIMATION RSS = 79 029 R2 = 0.42 Calculated Fisher criterion is 10.29 F(5, 70) = 2.35 α = 5% The 8th Tartu Conference on Multivariate Statistics
FORECASTING BY LINEAR MODEL The 8th Tartu Conference on Multivariate Statistics
5.4. CROSS-VALIDATION. SIM ESTIMATION The 8th Tartu Conference on Multivariate Statistics
THE VALUES OF RSS FOR SIM The 8th Tartu Conference on Multivariate Statistics
FORECASTING BY SIM WITH h0 = 2 The 8th Tartu Conference on Multivariate Statistics
THE VALUES OF RSS The 8th Tartu Conference on Multivariate Statistics
CONCLUSIONS • Several regression models, which allow evaluating the influence of the main social-economic factors on the volumes of passenger conveyances by the railway transport in the regions of Latvia have been received. • Two group models were compared: the classical linear regression model and the single index model. • Various tests for hypothesis of explanatory variables insignificance and model correctness have been lead. • The results of analysis show the obvious preference of the single index model in cases of smoothing and forecasting. The 8th Tartu Conference on Multivariate Statistics
REFERENCES • A. Andronov et al. Forecasting of passenger conveyances on the air transport. Transport, Moscow, 1983 (in Russian). • A. Andronov, C. Zhukovskaya and D. Santalova. On Mathematical Models for Analysis and Forecasting of the Europe Union Countries Conveyances. In RTU zinātniskie raksti, Informācijas tehnologijas un vadības zinātne, 2006 • W. Härdle et al. Nonparametric and Semiparametric Models. Springer-Verlag, Berlin, 2004. • E. Kopytov and V. Demidovs. Virtual Anticipatory Models in Decision Support System of Railway Transportation. In Daniel M. Dubois, editor, International Journal of Computing Anticipatory Systems, Published by CHAOS, Institute of Mathematics, University of Liege, 2006. • Annual Report of State Joint-Stock Company “Latvijas dzelzceļš” for 2003. Published by SJSC “Latvijas dzelzceļš”, Riga, 2004, (in Latvian). • D. Santalova. Forecasting of Railway Freight Conveyances in EU Countries on the Base of the Single Index Model, In Proceedings of RelStat’06, Riga, 2006 (in printing). • M.S. Srivastava. Methods of Multivariate Statistics.John Wiley & Sons Inc, New York, 2002. • Statistical Yearbook of Latvia 2003. Published by Central Statistical Bureau of Latvia, Riga, 2003. The 8th Tartu Conference on Multivariate Statistics
THANK YOU FOR YOUR ATTENTION The 8th Tartu Conference on Multivariate Statistics