Download
1 / 29
290 likes | 318 Views
Learn about the collaboration between ECCC researchers and partners to improve UV index forecasting, including the use of advanced data assimilation systems and case studies. Explore the methods, objectives, and future steps in enhancing UV forecasts.

E N D
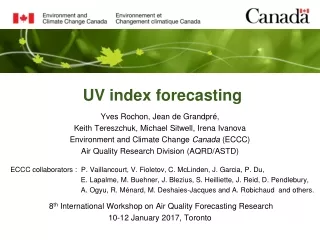
Yves Rochon, Jean de Grandpré, Keith Tereszchuk, Michael Sitwell, Irena Ivanova Environment and Climate Change Canada (ECCC) Air Quality Research Division (AQRD/ASTD) ECCC collaborators : P. Vaillancourt, V. Fioletov, C. McLinden, J. Garcia, P. Du, E. Lapalme, M. Buehner, J. Blezius, S. Heilliette, J. Reid, D. Pendlebury, A. Ogyu, R. Ménard, M. Deshaies-Jacques and A. Robichaud and others. 8th International Workshop on Air Quality Forecasting Research 10-12 January 2017, Toronto UV index forecasting
Outline • Background • Official UV index forecasts at ECCC • New UV index forecasting project: origin and objectives • Description of UV index forecasting system • Global chemical data assimilation system • UV index estimation • Case study: Summer of 2015 Pan-Am Games • Clear-sky conditions • All-sky conditions • Next steps for 2017
Background Official UV index forecasts at ECCC • Then state of the art approach implemented in 1993 based on Burrows et al. (1994) with later adjustments from V. Fioletov. (ec.gc.ca/uv) • Total column ozone forecasts estimated from mid-day 1-2 day weather forecast conditions over the NH with a resolution of 2.5. • Relies on derived relationships between column ozone Canadian Brewer measurements and weather conditions. • Total column ozone forecast field adjusted using current daily averaged Canadian Brewer measurements (up to 4-7 stations used). • Solar noon clear-sky surface UV flux (and UV index) forecasts estimated from a relationship to column ozone amounts • UV index provided for 954 locations across Canada. • Adjustments made related to snow cover and altitude • Impact of mid-day average cloud opacity (and precipitation) reflected using a tabular scale fromforecasters` weather predictions How are the UV index forecastsgenerated?
BackgroundNew UV index forecasting project Origin • Various projects on stratospheric ozone assimilation and forecasting have been conducted at ECCC over the past two decades. • Movingtowardsoperationalchemical data assimilation • Proposal to employthiscapability in UV index forecasting Objectives • Offer a possible update to the UV index forecasting service provided by ECCC to Canadians • Make direct use of • ozone model forecasts (LINOZ) at NWP resolution • satellite measurements of ozone through data assimilation • GEM model UV fluxes for estimating clear-sky and all-sky UV indices
Objectives (cont’d) • Allow the availability of new UV index forecast products, e.g. • daily max • daytime variation (e.g. hourly) • longer forecasts (e.g. 4 days or more) • 2014 survey of members of the Ontario Sun and Safety group identified the desire of UV forecasts extending over a longer period • also done by other weather centers • easily implemented with this system • global, continental and regional maps • Offer the capability of using regional and higher resolution forecasts for improved cloud representation • Offer a UV index forecasting package more tightly integrated to the current weather forecasting system
Description of UV index forecasting system Global Chemical Data Assimilation system Met Analysis GOME-2 during Pan-Am Games Met Analysis chem obs chem obs chem obs O3 Analysis O3 Analysis O3 Analysis 6-hr forecast 6-hr forecast 6-hr forecast ~3% reduction in predictability of total column ozone 4 day forecasts 4 days forecast 4 days forecast Components GEM-LINOZ 3D-Var (+obs) Met. Anal. Kuklos (GEM-MACH-Global) (EnVar) from GDPS (Maestro)
Description of UV index forecasting system UV index estimation Erythemal Action Spectrum from McKinlay and Diffey (1987) Adopted by the Commission Internationale de l’Éclairage, International Commission on Illumination (CIE) High resolution spectral simulation using CloudJ (Prather 2015) 330-400 nm 310-330 nm 294-310 nm 280-294 nm
Sample UV index forecast fields: Date: 18 UTC, 24 Aug. 2015 (fcst from 00 UTC) GEM-LINOZ forecasts Clear-sky All-sky
UV index estimation from scaled UV broadband irradiances Clear-sky UV index • Differences in UV index from GEM for the two methods under clear-sky conditions relative to the CloudJ (Prather, 2015) values from integration of high resolution spectra Integration approach Linear sum of four bands 7 day averages at 18UTC in August 2015. UVI = 40 F280-294 + 10.0 F294-310 + 0.26 F310-330 + 0.0037 F330-400
Factors affecting the accuracy of UV index forecasts • Prognostic ozone (and total column ozone) errors • [as well as aerosols, haze, pollution (not evaluated here)] • - 1% increase in ozone at ~300 DU = decrease in UV index by ~1.2% • - Parallel project on satellite observation column ozone bias • estimation/correction in progress. • Effect of ice/snow albedo errors (not evaluated here) • Forecast representativeness of true cloud cover • Radiation code representativeness of cloud characteristics • Surface irradiances (and UV index) are determined from overhead columns and not directly from the line of sight with the Sun • Can induce estimation errors for non-uniform cloud distribution
Cloudy conditions • Cloudy conditions results in an attenuation of clear-sky values. • Clear-sky formulations in use of broadband values as compared to high resolution spectra valid for all-sky conditions for the same model! • Accuracy in representing cloud impact by the broadband radiation code is a separate issue • GEM and CloudJhave differences in cloud radiation setups and differ in results. Not known which if any is better at this point. • Same GEM input liquid and ice water mixing ratios and cloud fraction • Componentswere differences are present: • Cloud layer vertical overlap scheme • Cloud scattering and absorption (optical depths) • GEM: Markovic et al, QJRMS (2008); Paquin-Ricard et al, Mon. Wea. Rev. (2010) • CloudJ: Prather, Geosci. Model Dev. (2015)
Case study: Summer of 2015 Comparison to Brewers and lowercostsensors • Evaluation for clear-sky conditions • Evaluation for all-sky conditions
Canadian network of Brewer and ozonesonde stations Data archived at the World Ozone and Ultraviolet Radiation Data Centre (woudc.org) 7 Brewer stations during Summer 2015 See: http://exp-studies.tor.ec.gc.ca for various column ozone and UV index products <3 Photo of Mark III Brewer Spectrometer Credit: Zipp and Zonen Aside: Pandora instruments being evaluated Also Brewers at Mauna Loa, Hawaii, and the South Pole operated with NOAA (USA)
Clear-sky UV index • Percent differences from Brewers • Total column ozone (1-day forecasts) with 15 minutes sampling interval: • Overestimation by ~1-4% relative to Brewer data. (Fcst – Brewer) x 100 Brewer • UV index (1-day forecasts): • Corresponding avg underestimation as large as • 5% at lower SZA • Validates clear-sky UV index calc for southern stations. • Source of overestimation at high SZA (i.e. Arctic stations) not known (10% of 3 is only 0.3 though)
Comparison of experimental (new) and official solar noon clear-sky UV index at the Brewer locations For southern Brewer locations, datasets consistent to within the error stemming from the satellite column ozone bias (which can be reduced). How do they compare away from Brewer locations where the new product has the advantage of satellite DA? (tbd) Ozone parameterized from weather and adjusted with Brewers From modelled/assimilated ozone
New UV Sensors (MSC) http://wisdom.phims.ca • UV sensors from Kipp & Zonen to be evaluated during the Games • Four stations: • Egbert • Downsview • UofT • Hamilton • Developed specifically to provide the UV index • Provide diurnal variation as the Brewers <3 Photo by Jonathan Kwong
Clear-sky UV index based on Downsview Brewer clear and nearly-clear sky conditions Percent differences of 1-day forecasts relative to MSC sensors Forecasts larger by 12-30% on average except with UofT sensor. Considering forecast differences with Brewers at low SZA, this suggests values from three MSC sensors underestimate UV index values by ~15-33%. MSC sensors Fcst, Brewers Scaling done for following analysis. No evident variation in SZA for MSC sensors (differs from Brewers) 100 x (Fcst – Sensor) Sensor
UV index 4-day forecast from 2015/07/10 UV index UV index Brewer GEM GEM-op Brewer GEM GEM-op UV index UV index Brewer GEM GEM-op Brewer GEM GEM-op Hours from 00Z Hours from 00Z
Metrics applied to all-sky daily max UV index forecasts PC = (a11+a22+a33) / x 100 : Percent Correct PD (UV>6) = (a22 +a23+a32+a33)/ (a12 + a13 + a22 +a23+a32+a33) x 100: Hit Rate PFD (UV>6) = (a21 +a31)/ (a11 + a21 + a31) x 100 : False Alarm Rate ETS (UV>6) = (a22 +a23+a32+a33)/ (aij- a11) x 100 : Threat Score
Input for UofT MSC sensor metrics (case 1) Based on daily max UV index
Remarks and summary of UV index results • This UV index forecasting system is part of a fully comprehensive CDA system which uses a prognostic ozone for the computation of UV fluxes. • UV index forecasting is feasible using 2-4 UV broadbands. • Accuracy mostly limited currently by the ability to correctly forecast cloudsand possibly in correctly reflect their radiative impact. • For clear sky conditions, the UV index forecast can be extended to several days (not shown here) due to good column ozone predictability. • The current system can predict high and above (UVI>6) UV index daily max conditions with a hit rate greater than 90% at most sites (exception likely related to elevation mismatch due to grid resolution). • The false alarm rate of predicting high and above UV index daily max for less than high actual UV index max can reach as high as 50-70%. • Changing GEM model configuration(s) affecting clouds can change the false alarm rate at most observation sites.
Next steps for 2017 • Complete evaluation of the UV index forecasting system • Extend diagnostic analysis to include Summer 2014 if not also 2016 • Compare to Brewer and Dobson measurements from the NOAA Global Monitoring Division (GMD) if not also satellite-based UV index estimates • Comparison with the ECCC official all-sky daily UV index forecasts • Compare GEM cloud/precip forecasts to satellite cloud measurements and radar precip. data (courtesy of Janti Reid from Cloud Physics) • Complete migration CDA (and UV index) forecast system to the latest NWP assimilation system
Additional contributors and acknowledgements Special thank you for the operational implementation of the UV index system during the 2015 Pan Am / Para Pan Am Games Chantal Duhaime, Jonathan Kwong, Dave Henderson, Stoyka Netcheva, Joan Klaassen, John, MacPhee, Dave Halliwell, WISDOM/PHIMS team, Sylvie Leroyer, and others, for information and consultation regarding the official UV index forecasting process, Denis Vigueux, Franco Petrucci, Vitali Fioletov, Gérard Croteau, and others and to Heather Morrison, Véronique Bouchet, Louis Garand, Godelieve Deblonde, and Howard Barker.
AQRD’s Operational Implementation Plan for Chemical Data Assimilation Objective Analysis Version 1 (OA-v1) Operational EnVar Developments for Chemical Data Assimilation Objective Analysis Version 2 (OA-v2) Near-Real Time Ozone Assimilation and UV Forecasting (CDA-UV1) Regional Chemical Data Assimilation Version 1 (CDA-AQv1) Near-Real Time Ozone Assimilation and UV Forecasting with GDPS and interactive ozone (CDA-UV2) Global/Regional Air Quality Data Assimilation with EnVar (CDA-AQv2)
Probability density functions of relative differences in UV index (GEM vs Cloud-J) Mod:effective radius of ice crystals in GEM increased from 15 to 20-50 m. With SZA filtering (SZA < 70°) All ECC values
5th order polynomial fit of the UV sensor irradiances to the UV index from Downsview Brewers for one of the sensors (Jonathan Kwong) Instrument spectral response function has some similarity to erythemal action spectrum. <3