Examples of Analysis Projects Based on ITP Data
210 likes | 232 Views
Explore the Polar Profiling Float design, deployment, and data from Arctic & Southern Ocean regions. Learn about the sensors used, history, future plans, and conclusions from these cutting-edge oceanographic tools.

Examples of Analysis Projects Based on ITP Data
E N D
Presentation Transcript
Examples of Analysis Projects Based on ITP Data AON workshop March, 2008
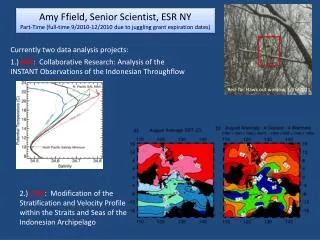
Temperature and Salinity Profiles through Atlantic Water Eddy
Normalized Θ – S dot plot with estimated slopes
Estimated vertical heat flux through DD staircase using 4/3rds flux law W/m2
Interannual variability McPhee
Polar Profiling Floats Breck Owens Peter Winsor WHOI
Polar Profiling Float Design • Uses Iridium for 2 way communications, and GPS for positioning. Can also use subsurface acoustic tracking for positioning. • Drifts at a programmable depth up to ~ 2000 m, and goes to its maximum depth to make CTD profile. It also obtains GPS fixes at the start and end of the surface phase. • Sensors including Temperature, Salinity, Pressure, and Dissolved Oxygen (all from SBE). • Ice detection algorithm uses conductivity with Iridium satellite to detect open water. If no link established, it submerges to 50 m, waits 2 hours and surfaces again. Will try 50 times and then go on to next profile. • With dissolved oxygen sensor, nominal lifetime is 4-5 years with profiles every 10 days.
History and Future Plans 2004: Polar Profiling Float design completed as modified SOLO float design, included Iridium Communications, GPS positioning, Iridium/GPS patch antenna, and ice detection algorithm 2005: Deployed 3 floats from Icebreaker Oden in Arctic Ocean. Algorithm worked, but error in float mission timing. Demonstrated concept worked. 2006: Corrected errors in code. Incorporated NAL 9601 Iridium Modem (lower power and cost, similar in size and cost to an Argos PTT). Deployed 3 floats off Antarctica from Oden. 2007: Incorporated SBE 43i Dissolved Oxygen sensor into design.Deployed 10 floats from Icebreaker Palmer. (9 worked fine, one was launched in heavy ice conditions and has not telemetered data back to shore. 2008:Have NSF MRI funding to purchase parts for 8 PPF floats for the Arctic. Have obtained internal WHOI funding to assemble and deploy the floats. Summer 2008 we will deploy the floats in Beaufort Gyre and to the west of Herald Canyon in deep water near the shelf break. 2009:Would like to have array to investigate the upper layer dynamics and thermodynamics of the open water system now developing in the western Arctic. These floats seem to be the only way to get sustained observations in this seasonally covered system.
Data from 2 floats in the Southern Ocean • Launched from ODEN in December 2006 • In open water. Has surfaced after each profile and sent data immediately. Has completed 45 10 day cycles. • Notice seasonal cycle in both T and S in the mixed layer due to nearby ice melt. • Data for these floats in incorporated into the Argo data system and is available in real-time.
Data from 2 floats in the Southern Ocean • Launched from PALMER in October 2007 • In seasonal ice cover. Did not find open water after 2nd and 3rd profiles. Has completed 16 10 day cycles. Apparently was caught in ice after profile 12 and did not make a profile for profile 13. • Notice fresh surface layer due to ice melt at end of austral summer. Demonstrates that the float can find open water even in winter and can survive collisions with sea ice.
Conclusions We have demonstrated that the Polar Profiling floats can operate in ice covered regions and operated for extended periods of time. The code for the floats appears to be robust and able to continue after not finding open water to transmit data. We have successfully deployed a float equipped with a dissolved oxygen sensor off Bermuda. Earlier problems with the SBE43i sensor appear to have been corrected so that the sensor has remained within calibration limits for the first 8 months of its deployment. We will deploy floats in the western Arctic Ocean in Summer 2007, we anticipate that these floats will remain in the western Arctic for several years and will be providing year round coverage. Polar Profiling floats are an excellent match with the Ice-tethered Profilers which operate well in areas with year round ice coverage. Polar Profiling Floats can provide similar coverage in seasonally ice-covered regions.