Download
1 / 41
410 likes | 577 Views
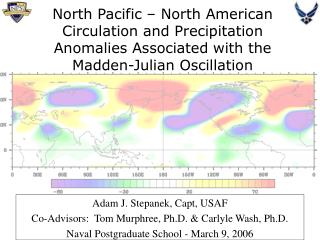
North Pacific – North American Circulation and Precipitation Anomalies Associated with the Madden-Julian Oscillation. Adam J. Stepanek, Capt, USAF Co-Advisors: Tom Murphree, Ph.D. & Carlyle Wash, Ph.D. Naval Postgraduate School - March 9, 2006. Overview of Presentation.

E N D
North Pacific – North American Circulation and Precipitation Anomalies Associated with the Madden-Julian Oscillation Adam J. Stepanek, Capt, USAF Co-Advisors: Tom Murphree, Ph.D. & Carlyle Wash, Ph.D. Naval Postgraduate School - March 9, 2006
Overview of Presentation • Introduction: Motivation / Background • MJO Impacts • Prior Studies • Data • Methods • Analysis • Key Composite Results • Individual Cases • Summary and Conclusions • Future Work • References and Acknowledgements
Motivation for Research • Desire to increase DoD awareness of tropical-extratropical teleconnections • Investigate the potential of the Madden-Julian Oscillation (MJO) as a forecast tool for DoD operations • Both tropical and extratropical weather are personal interests, so investigating tropical-extratropical interactions was a good thesis fit
What is the MJO? • The Madden-Julian Oscillation (MJO) is a tropical, quasi-periodic, propagating, intraseasonal oscillation that is most prominent in the equatorial regions of the Indian and Pacific oceans. • Convective and subsidence components • Eastward propagating (average phase speed 8 m/s) • Period of 30-60 days • Zonal wavelength 1 phenomenon • Major contributor to intraseasonal weather variability (tropics & extratropics) • The MJO was first identified by Roland Madden and Paul Julian in a breakthrough paper in 1971. • MJO impacts on the North Pacific / North American (NPNA) region have been a research focus over the past decade, but methods for forecasting these impacts are still very limited.
MJO Effects on western CONUS DoD Ops • The MJO has been demonstrated to have effects in the extratropics. • Anomalous precipitation events in North Pacific –North America (NPNA) have been linked to MJO via teleconnections, including the following high precipitation events in western CONUS: • December 2004 – January 2005 • December 1996 - January 1997 (DoD Humanitarian Missions with flooding in Sierra Nevada Region) • January 1995 • The mechanisms for and the predictability of the NPNA impacts are not well understood.
Prior Research on MJO Teleconnections • Critical studies on MJO teleconnections with a focus on the NPNA region include: • Bond and Vecchi (2003) - WA/OR • Jones (2000) – central and southern CA • Mo and Higgins (1998) – western CONUS • Mo and Higgins (1997) – north Pacific (NPAC) • Major findings from these studies include: • Anomalous precipitation patterns in the western CONUS are highly dependent on the location of MJO anomalous convection, but no clear agreement on specific impacts of each MJO phase • MJO teleconnections in the northern hemisphere occur primarily in winter months • An active MJO period is more likely to produce extreme precipitation events in the western CONUS • However, many variables with potential impacts on MJO teleconnections have not been thoroughly investigated, including • Importance of MJO features (amplitude, subsidence portion of MJO, etc.) • Seasonal variations • El Nino / La Nina interactions
Winter Weather Anomalies Prior to Heavy West Coast Precip Events Modeled Response to Tropical Forcing H L L H H = schematic energy propagation through wave train from east Asia = anomalous tropical heating Prior Research on MJO Teleconnections • These schematics describe mechanisms by which the MJO impacts the NPNA region. But how often, and just when, do these mechanisms occur in the real world? Left image from Module 14: Teleconnections, Modern Climatology Course, Prof Tom Murphree, NPS Right image from: http://www.cpc.ncep.noaa.gov/products/intraseasonal/intraseasonal_faq.html#what
Key Hypotheses • Hypothesis 1: NPNA response to the MJO is sensitive to: • MJO Phase • MJO Amplitude • Season of MJO Occurrence • Concurrent state of El Nino / La Nina (EN/LN) • Hypothesis 2: By knowing the variables to which the NPNA response is highly sensitive, we can improve forecasts of NPNA circulation and precipitation
Data • Primary Data • NCEP/NCAR Reanalysis Data • 200-hPa heights (Z200) • Outgoing longwave radiation (OLR) • Precipitation rate • Unlike prior studies, data was not filtered to highlight only the MJO / intraseasonal signal • MJO Index: The Real-time Multivariate MJO (RMM) Index • Based upon multiple variables (OLR, U850 winds and U200 winds) • Updated on a near real-time basis – critical to use in forecasting • El Nino / La Nina (EN/LN) Index: The MEI Index • Updated on a bi-monthly basis • Based on six oceanic/atmospheric variables in the tropical Pacific
Methods • Key Methodology: Composite various atmospheric fields based upon the RMM, especially four factors: • MJO Amplitude (high vs. low) • Phase of the MJO (1-8) • Season of MJO occurrence (OND vs. JFM) • El Nino and La Nina background state • Also analyze effects of: • Lagging the dates within each composite • Case following vs. non-case following
Methods • Amplitude Based Method (ABM): Composite cases in which for 3 or more consecutive days MJO amplitude met or exceeded a given amplitude • Assumption is that a persistent disturbance is needed to excite an extratropical response • Each phase is viewed separately (e.g., phase 1 days are not necessarily part of same event as phase 2 days) • Case Following Method (CFM): Use specific MJO phase (phase 4) and examine all events meeting ABM standards; trace event through its full lifecycle (phases 1-8) • Closer resemblance to real-world analysis of MJO • First, create Benchmark Results to do initial assessment of the effects of the four factors on the NPNA response
Methods All Months, All Amplitudes (1.00+), All EN/LN/N, No Lag Change Phase Only Categorize by EN, LN and N Change Amplitude Only Change Season Only Investigate Case Following versus Non-Case Following Investigate Lagging Schemes Determine Critical Factors and their NPNA Impacts
Positive OLR Anomalies = Subsidence Component of MJO Negative OLR Anomalies = Convective Component of MJO Benchmark Results: Phase 3 / All Amplitudes / ONDJFM / EN, LN & N Combined OLR Anomaly Precip Rate Anomaly • Anomalously wet conditions for BC and Pacific Northwest (PNW)
Benchmark Results: Phase 3 / All Amplitudes / ONDJFM / EN, LN & N Combined 200-hPa Anomaly • Relatively well-defined wave train from east Asia to NPNA Approximate Center of MJO Convective Phase Approximate Center of MJO Subsidence Phase Energy Propagation through Extratropical Wave Train Tropical Rossby Wave Response to MJO
Benchmark Results: Phase 3 / All Amplitudes / ONDJFM / EN, LN, & N Combined Z500 Anomaly • Equivalent barotropic structure evident in extratropics • Allows interpretation of anomalous low-level flow from upper-level height anomalies Z850 Anomaly
Impacts of MJO Phase on OLR Anomalies Ph: 5 Ph: 1 Ph: 6 Ph: 2 Ph: 3 Ph: 7 Ph: 4 Ph: 8
Impacts of MJO Phase on Z 200 Anomalies Ph: 5 Ph: 1 Ph: 6 Ph: 2 Ph: 7 Ph: 3 Ph: 4 Ph: 8
Impacts of MJO Phase on the NPNA Response • Propagation of the convective and subsidence components of the MJO results in changes in the tropical Rossby/Kelvin response. • Extratropical wave trains change significantly throughout the lifecycle of the MJO. • Anomalies in onshore/offshore flow over the western CONUS are altered as wave trains change. • Phase is critical in analyzing MJO teleconnections.
Impacts of MJO Amplitude on the NPNA Response Phase 3 – All Amplitudes > 1.00 Phase 3 – Low Amplitudes (1.00-1.50) Phase 3 – High Amplitudes (1.50+) • Responses to low to high amplitude events are different in some ways. • NPNA differences may lead to differences in western CONUS precipitation.
Impacts of Season on NPNA Responses to MJO Phase 3 – All Seasons (Z200) Phase 3 – OND Only (Z200) Phase 3 – JFM Only (Z200) • Seasonal differences are not large in this example comparison, but are notable for some other phases. • One possible cause of seasonal differences: changes in background flow (e.g., east Asia – north Pacific subtropical jet).
OLR - All Cases OLR - La Nina Cases OLR - El Nino Cases OLR - Neutral Cases Impacts of El Nino & La Nina on NPNA Response • El Nino / La Nina have a large effect on MJO activity through interference with MJO convection (e.g., over maritime continent, MJO phase 3 subsidence is destructively interfered with by La Nina convection).
Z200 - All Cases Impacts of El Nino & La Nina on NPNA Response Z200 - El Nino Cases Z200 - La Nina Cases Z200 - Neutral Cases • Both tropical and extratropical responses are quite different for EN, LN, and neutral cases. • Interference of EN/LN processes with MJO processes may explain differences
Determination of Critical FactorsGoverning NPNA Response to MJO Critical Factors MJO Phase Concurrent El Nino / La Nina Season of MJO Occurrence • Some hypotheses appear to be correct, while others still lack solid evidence (e.g., amplitude hypothesis).
Wet & Dry Periods: California & Desert Southwest • Constructed 48 composites of active MJO periods based on 3 critical factors: MJO phase, season, EN/LN/neutral. • Composites analyzed to identify conditions most closely associated with precipitation anomalies over western CONUS. • Following slides show Z200 and precipitation rate anomalies for conditions under which California - Desert Southwest (CA-DSW) region experienced most positive and most negative precipitation anomalies. • Conditions most closely associated with anomalously positive precipitation • 1) OND / Neutral – Phase 2 • 2) OND / Neutral – Phase 6 • 3) JFM / El Nino – Phase 1 • 4) JFM / El Nino – Phase 2 • 5) JFM / El Nino – Phase 7 • Conditions most closely associated with anomalously negative precipitation • 1) OND / El Nino – Phase 4 • 2) OND / La Nina – Phase 7 • 3) JFM / La Nina – Phase 3 • 4) JFM / La Nina – Phase 7 • 5) JFM / Neutral – Phase 8
Key Composites: 5 Wettest CA Composites • Characteristics: Anomalous low positioned to the west and north of CA, with anomalous high to south, sets up anomalously onshore flow between low and high. • Generally an east/west or southwest/northeast tilt to the anomalous low, helping to draw in warm, moist air from the tropical regions
Key Composites: 5 Driest CA Composites • Characteristics: Anomalous high to north and west of CA, with an anomalous low off to south and west, causing offshore flow of dry continental air over CA
Composite of 5 Wettest Periods in CA Composite of 5 Driest Periods in CA Comparison of Driest and Wettest Composites • Composites based on MJO and wet (dry) conditions in CA-DSW show clear EN (LN) patterns in tropical and northeast Pacific. • Onshore/offshore flow anomalies a major contributor to western CONUS precip anomalies.
Comparison of Driest and Wettest Composites Composite of 5 Wettest Periods in CA Composite of 5 Driest Periods in CA • Large scale factors causing CA-DSW precip anomalies lead to opposite precip anomalies in western Canada.
Critical Schematics CA: Dry Conditions CA: Wet Conditions Anomalous Low-level Flow Anomalous Low-level Flow L H L H
Key Results • Favorable (F) and unfavorable (U) conditions during MJO activity for fall-winter: • Positive precipitation anomalies in CA-DSW: F: Early and late phases of MJO F: Presence of neutral conditions in OND F: Presence of El Nino during JFM F: Anomalous wave train from Asia with low over northeast Pacific F: SW-NE tilt to anomalous low-high dipole over northeast Pacific U: Middle phases of MJO U: Presence of LN • Negative precipitation anomalies in CA-DSW: F: Middle and late phases of MJO F: Presence of La Nina F: Anomalous high over northeast Pacific F: SW-NE tilt to anomalous high-low dipole over northeast Pacific U: Early phases of MJO
Key Results • MJO - NPNA teleconnections are very complex. • So far, only rudimentary forecasting rules-of-thumb • Complexity may be reduced by use of intraseasonal band-pass filter. • However, real-world is unfiltered and is what forecasters must deal with
MJO convection MJO subsidence Individual Case: Dec 04 – Jan 05 Precip Rate Anomaly • Moderate MJO; phases 3 & 4; OND into JFM; neutral background regime • Similar characteristics to wet pattern with SW-NE oriented low near the CA coastline, and precip dipole over western CONUS • Strong onshore flow with origins of flow in tropics;
MJO convection MJO subsidence Individual Case: Dec 1996 – Jan 1997 Precip Rate Anomaly • Very strong MJO; phase 3-8 (select days); OND into JFM; neutral background regime • Similar characteristics to wet pattern with SW-NE oriented low near the CA coastline, and precip dipole over western CONUS • Strong onshore flow with origins of flow in tropics
MJO convection MJO subsidence Individual Case: January 1995 Precip Rate Anomaly • Moderate MJO; phases 3-5; JFM; El Nino background regime • Slightly different orientation of anomalous low, with onshore flow originating in sub-polar regions • Duration of onshore flow appears reason for flooding over much of CA; EN influences evident
Additional Findings • Subsidence Phase of the MJO: Has the ability to cause a significant tropical Rossby wave response and thus influence the extratropical wave train pattern • MJO Impacts on Southwest Asia (SWA): Phases 2, 3, 6, & 7 of the MJO can have strong effects on weather in SWA through the Rossby wave response to the convective and subsidence components of MJO • MJO amplitude and MJO propagation speed: Stronger MJOs appear to propagate more slowly than do weaker MJOs; may indicate effects of greater atmosphere-ocean coupling for strong MJOs • MJO amplitude and persistence of NPNA response: Response is more persistent when amplitude is high; may be related to slower propagation of strong MJOs
Summary and Conclusion • The relationship between the MJO and NPNA circulation and precipitation anomalies is very complex when looking at non-filtered data, with few, if any, simple rules of thumb to guide forecasters • Attempting to base forecasts solely on MJO phase is too simple an approach – other factors are also critical • A longer data set appears necessary in order to create more concrete MJO teleconnection rules, especially rules based on ambient background conditions • 26 years of data analyzed, but most composites have less than 100 days • However, the MJO has the ability to strongly influence the extratropical circulation pattern, and appears to have great potential as a tool for improving extended-range forecasts of the extratropics
Future Work • Investigate precipitation anomalies in western CONUS regions through use of a more refined precipitation data set • Investigate properties of background flow that contribute to the development of different wave train formations • Investigate time evolution of wet and dry composites, especially with respect to background flow patterns
References • Bond, N. A., and G. A. Vecchi, 2003: The Influence of the Madden-Julian Oscillation on Precipitation in Oregon and Washington. Wea. Forecasting, 18, 600-613. • Jones, C., 2000: Occurrence of Extreme Precipitation Events in California and Relationships with the Madden Julian Oscillation. J. Climate, 13, 3576-3587. • Mo, K. C., and R. W. Higgins, 1998: Tropical Convection and Precipitation Regimes in the Western United States. J. Climate, 11, 2404-2423. • Wheeler, M. C., and H. H. Hendon, 2004: An All-Season Real-Time Multivariate MJO Index: Development of an Index for Monitoring and Prediction. Mon. Wea. Rev., 132, 1917-1932. • NCEP/NCAR Reanalysis Products constructed at NOAA/CDC: http://www.cdc.noaa.gov/Composites/Day/ • CPC MJO Index charts available at: http://www.cpc.ncep.noaa.gov/products/precip/CWlink/daily_mjo_index/pentad.html • RMM1/RMM2 Index charts available at: http://www.bom.gov.au/bmrc/clfor/cfstaff/matw/maproom/RMM/phasediag.list.htm • Graphics created using NCL software, available at • http://www.ncl.ucar.edu/
Acknowledgements • Co-Advisors: Professor Tom Murphree and Professor Carlyle Wash, NPS, Monterey, CA • NCL Assistance: Lt Col Karl Pfeiffer, USAF, NPS, Monterey, CA • Important Discussions and Information: Dave Reynolds, NWS, Monterey, CA, and Matthew Wheeler, Australian Bureau of Meteorology