Download

1 / 35
350 likes | 511 Views
The Australian Approach to the Production Based Measurement of GDP. Ian Ewing Deputy Australian Statistician Macroeconomics and Integration Group June 2009. Topics. The statistics ABS produces What the statistics are used for The methods used to compile them The data sources used

E N D
The Australian Approach to the Production Based Measurement of GDP Ian Ewing Deputy Australian Statistician Macroeconomics and Integration Group June 2009
Topics • The statistics ABS produces • What the statistics are used for • The methods used to compile them • The data sources used • The resources required • Challenges for the future
Uses of Statistics • Industry contribution to growth • Measuring structural change • Measuring productivity • Informing and evaluating public policy • Economic and business analysis • Forecasting
Uses of Statistics:Informing Policy Change in Australian sectoral growth rates (percentage points lost or gained) due to net mitigation costs under the 550 parts per million CO2 equivalent scenario, compared to no mitigation, 2013-2100. From the Garnaut review Figure 11.5.
Uses of Statistics:Economic Forecasting Table 3.2: Domestic economy forecasts(a)
Methods Used • The SNA Framework • Three estimates: Income, Expenditure, Production • Supply & Use Tables • Deflation (Chain Volume Indexes) • Agriculture • Owner Occupied Housing • International Comparability • Seasonal Adjustment • Financial Intermediation Services
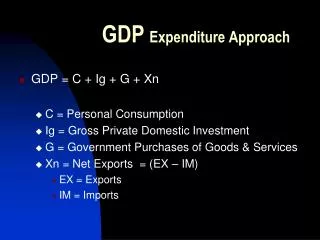
Methods Used:Three ways to measure GDP • GDP(P): The production measure that calculates the total value added by producer enterprises in the economy: i.e. the difference between the value of outputs produced and the value of goods and services consumed in production (intermediate inputs) adjusted for taxes and subsides on those products. • GDP(E): The expenditure based measure which calculates what government and households spend on the acquisition of those products. • GDP(I): The income based measure which sums the earnings which households derive from providing labour and capital services for use in generating production.
Methods Used:Supply and Use Tables Table 1. Supply of products at basic prices and purchasers’ prices
Methods Used:Supply and Use Tables Table 2. Use of products at purchasers’ prices
Methods Used:Supply and Use Tables • Output – Intermediate Use + margins + taxes on products – subsidies = Compensation of Employees + gross operating surplus + other taxes on production – subsidies on productionGDP(P) = GDP(I) • Supply=UseOutput + margins + Imports + Taxes on products – Subsidies on products = Intermediate Use + Domestic Final Use + Inventory changes + exports • Output – Intermediate Use + Margins + net taxes on products = Domestic Final Use + Inventory Change + Exports – ImportsGDP(P) = GDP(E)
Methods Used:Supply and Use Tables • Reconciles the three measures of GDP • Provides a systematic framework for identifying sources of error
Methods Used • Deflation (Chain Volume Indexes) • Agriculture • Owner Occupied Housing • Financial Intermediation Services • International Comparability • Seasonal Adjustment
Data Sources • Classification • Business Register • Administrative data sources • Business Surveys • Price Indexes
Data Sources:Classification • Industry: ANZSIC (ISIC Rev3) • Commodity: ANZSPC (CPC) • ANZSISC (ISISC)
Data Sources:Business Register • Built on Tax Administration • Unduplicated • Comprehensive • “Profiling” largest/complex firms • Core Classifications • Births/deaths • Size Measures
Data Sources • Administrative data sources • Business Surveys • Prices Indexes
Resources • Compiling Macro Economic Statistics: 220 Person Years • Compiling National Accounts: 64 Person Years • Compiling Annual and Quarterly GDP: 43 Person Years • Compiling GDP(P): 11 Person Years • Infrastructure and Source Data: 292 Person Years
Challenges for the Future • Scope Issues • New Industry Classification • Updated System of National Accounts (SNA 08) • Service Industry Output Measurement • Global Financial Crisis • Maintaining Professional Capability
Challenges for the Future: • Updated System of National Accounts (SNA 08) • Service Industry Output Measurement • Global Financial Crisis • Maintaining Professional Capability