Download
1 / 41
410 likes | 546 Views
This presentation explores the methodologies used to investigate dark energy and dark matter, including galaxy clustering, cluster counts, weak lensing, and the Lyman-alpha forest. It discusses current constraints, what has been learned so far, and future expectations in cosmology. Key topics include the growth of structures, classical tests such as the redshift-distance relation, and the scale dependence of cosmological probes. The importance of addressing systematics and statistics in cosmological measurements is emphasized, alongside new surveys and methods designed to optimize our understanding of the universe.

E N D
Overview of Large Scale Structure Uros Seljak Zurich/ICTP/Princeton/Berkeley/LBL Hamilton, may 16, 2007
Outline Methods to investigate dark energy and dark matter: galaxy clustering, cluster counts, weak lensing, Lya forest Issues of systematics and statistics Current constraints: what have we learned so far, controversies What can we expect in the future?
How to test dark energy? • Classical tests: redshift-distance relation (SN1A etc)… • Growth of structure: CMB, Ly-alpha, weak lensing, clusters, galaxy clustering • Scale dependence of structure (same tracers as above)
Growth of structure by gravity • Perturbations can be measured at different epochs: • CMB z=1000 • 21cm z=10-20 (?) • Ly-alpha forest z=2-4 • Weak lensing z=0.3-2 • Galaxy clustering z=0-2 Sensitive to dark energy, neutrinos…
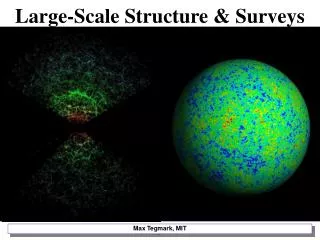
Scale dependence of cosmological probes WMAP CBI ACBAR Lyman alpha forest SDSS Galaxy clustering Weak lensing Cluster abundance Complementary in scale and redshift
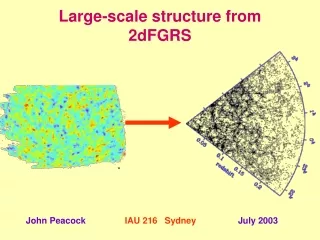
Galaxy surveys: SDSS and 2dF 400,000 galaxies with redshifts Galaxy and quasar survey
Shape and acoustic Oscillations in the Matter Power Spectrum • Shape determined by matter and baryon density • Amplitude not useful (bias) • Peaks are weak; suppressed by a factor of the baryon fraction. • Higher harmonics suffer from diffusion damping. • Requires large surveys to detect! Linear regime matter power spectrum
Galaxy power spectrum: shape analysis Galaxy clustering traces dark matter on large scales Current results: redshift space power spectrum analysis based on 200,000 galaxies (Tegmark etal, Pope etal), comparable to 2dF (Cole etal) Padmanabhan etal: LRG power spectrum analysis, 10 times larger volume, 2 million galaxies Amplitude not useful (bias unknown) Nonlinear scales
Power Spectrum • LRG analysis in Fourier space with a quadratic estimator for the power spectrum. • See also FKP analysis in Percival et al. (2006). Tegmark et al. (2006)
Systematics: nonlinear bias • Need to model nonlinear bias • Current analyses use Q model (Cole etal), where Q is either fixed from simulations (Q=5-10 for normal galaxies, Q=20-30 for LRGs in real space) or determined from the data by going to smaller scales (k=0.3h/Mpc) • Do NOT allow for Q to be free and only use k<0.1h/Mpc data (eg in Hamann etal 2007 they find even Q=60-100 is acceptable, completely incompatible with the data at k=0.2-0.3h/Mpc) • Need to move to a better model, but it is uncertain how much we will gain for cosmology
Are galaxy surveys consistent with each other? Some claims that SDSS main sample gives more than 2 sigma larger value of W Need to account for nonlinear bias Fixing h=0.7 Padmanabhan etal 2006 SDSS LRG photo 2dF SDSS main spectro Bottom line: no evidence for discrepancy if one marginalizes over nonlinear bias, new analyses improve upon SDSS main
Sound Waves • Each initial overdensity (in DM & gas) is an overpressure that launches a spherical sound wave. • This wave travels outwards at 57% of the speed of light. • Pressure-providing photons decouple at recombination. CMB travels to us from these spheres. • Sound speed plummets. Wave stalls at a radius of 150 Mpc. • Overdensity in shell (gas) and in the original center (DM) both seed the formation of galaxies. Preferred separation of 150 Mpc.
dr = (c/H)dz dr = DAdq Observer A Standard Ruler • The acoustic oscillation scale depends on the matter-to-radiation ratio (Wmh2) and the baryon-to-photon ratio (Wbh2). • The CMB anisotropies measure these and fix the oscillation scale. • In a redshift survey, we can measure this along and across the line of sight. • Yields H(z) and DA(z)!
Baryonic wiggles Best evidence: SDSS LRG spectroscopic sample (Eisenstein etal 2005), about 3.5 sigma evidence SDSS LRG photometric sample (Padmanabhan, Schlegel, US etal 2005): 2.5 sigma evidence 2dF comparable evidence
Current BAO constraints • SDSS LRG correlation function does show a plausible acoustic peak. • Ratio of D(z=0.35) to D(z=1000) measured to 4%. • This measurement is insensitive to variations in spectral tilt and small-scale modeling. We are measuring the same physical feature at low and high redshift. Wmh2 from SDSS LRG and from CMB agree. Roughly 10% precision. • This will improve rapidly from better CMB data and from better modeling of LRG sample. Wm = 0.273 ± 0.025 + 0.123(1+w0) + 0.137WK.
Concept proposed for the Joint Dark Energy Mission (JDEM). • 3/4-sky survey of 1<z<2 from a small space telescope, using slitless IR spectroscopy of the Ha line. SNe Ia to z~1.4. • 100 million redshifts; 20 times more effective volume than previous ground-based surveys. • Designed for maximum synergy with ground-based dark energy programs. • Fisherology predicts 0.2% error on D_a over 1<z<2 • But do nonlinear effects spoil this? Smith etal 2007 argue for 1-2% random noise on peak position! TBD • SYSTEMATICS are key!
Weak Gravitational Lensing Distortion of background images by foreground matter Unlensed Lensed
Weak lensing: systematic errors • PSF induced errors: rounding (need to calibrate), ellipticity (use stars) • Shear selection bias: rounder objects can be preferentially selected • Noise induced bias: conversion from intensity to shear nonlinear • STEP2 project bottom line: current accuracy in best codes at 2-3% level, plenty of work to do to reach 1% level, not clear 0.1% even possible • PHOTOz errors: without spectroscopy easily a 10-20% error (biasing sigma_8 high?), need complete spectroscopic surveys to the same depth! Currently this is only available for SDSS (DEEP2 and zCOSMOS data) • Intrinsic alignment has been detected and one MUST deal with it! Biasing sigma_8 low by 1-10% (Hirata etal)
Shear-intrinsic (GI) correlation Hirata and US 2004 • Same field shearing is also tidally distorting, opposite sign • What was is now , possibly an order of magnitude increase • Cross-correlations between redshift bins does not eliminate it • B-mode test useless (parity conservation) • Vanishes in quadratic models Lensing shear Tidal stretch
Intrinsic correlations in SDSS 300,000 spectroscopic galaxies, 36,000 LRGs No evidence for II correlations Clear evidence for GI correlations on all scales up to 60Mpc/h LRGs show the strongest signal Gg lensing not sensitive to GI Mandelbaum, Hirata, Ishak, US 2005 Hirata etal 2006
Implications for existing and future surveys Up to 30% effect on power spectrum for shallow survey at z=0.5 2-20% effect for deep survey at z=1: current surveys underestimate s8 More important for cross-redshift bins: separate redshift bins do not eliminate
Galaxy-dark matter correlations: galaxy-galaxy lensing • dark matter around galaxies induces tangential distortion of background galaxies: extremely small, 0.1% • Specially useful if one has redshifts of foreground galaxies: SDSS • +: Express signal in terms of projected surface density and transverse separation r: one projection less than shear-shear correlations • +: with photozs not sensitive to intrinsic alignments • -: for LSS one needs to model cross-correlation coefficient between dark matter and galaxies: simulations
Mandelbaum, US etal, in prep 2007previous attempts: Hoekstra etal, Sheldon etal Preliminary, not yet properly calibrated Statistical error around 5% final systematic error is likely to be smaller than for other weak lensing analyses Alternative method to determine growth rate with different systematics than shear-shear correlations!
WMAP-LSS cross-correlation: ISW Detection of a signal indicates time changing gravitational potential: evidence of dark energy if the universe IS flat. • Many existing analyses (Boughn and Crittenden, Nolta etal, Afshordi etal, Scranton etal, Padmanabhan etal) • Results controversial, often non-reproducible and evidence is weak • One of the few ways to probe dark energy clustering • Future detections could be up to 6(10?) sigma, not clear if this probe can play any role in cosmological parameter determination
2.5 sigma detection Consistent with other probes
Counting Clusters of Galaxies Sunyaev Zel’dovich effect X-ray emission from cluster gas Optical data: red sequence richness Weak lensing (future?) Simulations: growth factor
Galaxy Cluster Abundance Dependence on cosmological parameters Sunyaev Zel’dovich effect X-ray emission from cluster gas Optical data: red sequence richness Weak lensing (future?) # of clusters per unit area and z: comoving volume mass limit mass function mass function: Jenkins et al. 2001 Hubble volume N-body simulations in three cosmologies cf: Press-Schechter overall normalization power spectrum (8, M-r) growth function
Pros and cons of cluster abundance • Abundance very sensitive to cosmological parameters, specially sigma8 • Many different techniques to measure clusters • Need to calibrate observable to halo mass: simulations not yet reliable (resolution issues, turbulence, cosmic rays, magnetic fields…) • X-ray calibration not entirely reliable because clusters are not relaxed and may hve additional pressure support (cosmic rays, bulk motions) • Weak lensing reliable on average, but scatter is an issue: Malmquist and Eddington bias • one can show that Malmquist bias dominates, only a robust lower limit on sigma8 can be established (Mandelbaum and US 2007) • Studies that ignore scatter underestimate sigma8 • Self-calibration: promising, but not for general M(L) relation
Cluster abundance and masses with SDSS • maxBCG and LRG cluster catalogs (20-30k cluster sample!) It may be possible to give a lower limit from cluster clustering
Ly-alpha forest as a tracer of dark matter and dark energy Basic model: neutral hydrogen (HI) is determined by ionization balance between recombination of e and p and HI ionization from UV photons (in denser regions collisional ionization also plays a role), this gives Recombination coefficient depends on gas temperature Neutral hydrogen traces overall gas distribution, which traces dark matter on large scales, with additional pressure effects on small scales (parametrized with filtering scale kF) Fully specified within the model, no bias issues
SDSS Lya power spectrum analysisMcDonald, US etal 2006 • Combined statistical power is better than 1% in amplitude, comparable to WMAP • 2<z<4 in 11 bins • 2 ≈ 185.6 for 161 d.o.f.for SDSS • A single CDM model fits the data over a wide range of redshift and scale • WDM does not fit Ly-alpha helps by reducing degeneracies between dark energy and other parameters that Lya determines well (amplitude, slope…) Direct search for dark energy at 2<z<4 reveals no evidence for it
WMAP vs. LyaF (vanilla 6 parameters)Linear amp. & slope constraints at z=3, k=0.009 s/km • Green: LyaF • Red: WMAP • Black: WMAP, SDSS-main, SN • Yellow: All • Blue: Viel et al. (2004) independent LyaF
The amplitude controversy? • Some probes, Ly-alpha, weak lensing, SZ clusters prefer higher amplitude (sigma_8>0.85) • Other probes, WMAP, X-ray cluster abundance, group abundance… prefer lower amplitude (sigma_8<0.80) • Statistical significance of discrepancy is 2.5?-sigma or less • Most likely a combination of statistical fluctuations and residual systematic effects not modeled in one or more probes • In Ly-alpha most studies find that astrophysics effects (winds, UV background fluctuations, reionization…) on cosmological parameters are small, but more careful studies are needed
Bispectrum: measuring dark energy at z>2 Partial degeneracy between UV background flux and amplitude is broken, factor of 3 improvement in amplitude Can determine power law slope of the growth factor to 0.1 Mandelbaum etal 2003 Upcoming analysis on SDSS Slosar etal Will provide a much better amplitude and hopefully resolve the amplitude controversy Future of LYA: more data, nongaussian signal, 3-d analysis, better modeling and simulations… Simulations, not yet real data
Putting it all together • Dark matter fluctuations on 0.1-10Mpc scale: amplitude, slope, running of the slope • Growth of fluctuations between 2<z<4 from Lya • Lya very powerful when combined with CMB or galaxy clustering for inflation (slope, running of the slope), dark energy through growth rate comparison to z<1 data, can also detect it directly if DE is significant for z>2 • still important because it is breaking degeneracies with other parameters and because it is determining amplitude at z=3. US etal 04, 06
Dark energy constraints: complementarity of tracers US, Slosar, McDonald 2006
Time evolution of equation of state w Individual parameters very degenerate
Time evolution of equation of state • w remarkably close to -1 • Best constraints at pivot z=0.2-0.3, robust against adding more terms • In a 3 parameter expansion error at pivot remains the same as for constant w
Future surveys and issues of statistics • Weak lensing: ground (Panstarrs, DES, LSST), space (SNAP, Dune) • Cluster surveys: SZ, X-rays, optical • BAO: APO-LSS, ADEPT • Ly-alpha: nothing dedicated but can be part of a general spectroscopic survey • Beyond Fisherology in figure of merit: there is realization noise in error predictions vs reality, more so for nongaussian distributions. • Realization noise leads to weakening of predicted power in discriminating between models (because we can be unlucky in the realization)
Realization noise In some cases (eg, with positivity requirement) a factor of two difference between Fisher prediction and actual realization One should report the realization noise in figure of merit and two experiments within the error margin should be deemed equal in power We need to focus more on higher sigma contours, 3 and beyond! Slosar and US, in prep
Conclusions • LSS can probe dark energy through a number of techniques, including galaxy clustering, weak lensing and their cross-correlations, cluster abundance and clustering and Ly-alpha forest • Dark energy remarkably similar to cosmological constant, w=-1.04+/- 0.06, no evidence for w evolution (or modified gravity) • Best constraints achieved by combining multiple techniques: this is also needed to test robustness of the results against systematics. • Future prospects: many planned space and ground based missions, this may lead to a factor of several improvements in dark energy parameters like w, w’. • Systematics, systematics, systematics, statistics • Much to be learned, but there remains much work to do for everyone involved