Large-scale structure from 2dFGRS
Large-scale structure from 2dFGRS. John Peacock IAU 216 Sydney July 2003. The distribution of the galaxies. 1930s: Hubble proves galaxies have a non-random distribution 1950s: Shane & Wirtanen spend 10 years counting 1000,000 galaxies by eye

Large-scale structure from 2dFGRS
E N D
Presentation Transcript
Large-scale structure from 2dFGRS John Peacock IAU 216 Sydney July 2003
The distribution of the galaxies 1930s: Hubble proves galaxies have a non-random distribution 1950s: Shane & Wirtanen spend 10 years counting 1000,000 galaxies by eye - filamentary patterns?
Redshift surveys Inverting v = cz = Hd gives an approximate distance. Applied to galaxies on a strip on the sky, gives a ‘slice of the universe’
Spectrum of inhomogeneities r x Primordial power-law spectrum (n=1?) Transfer function
Key scales: * Horizon at zeq : 16 (Wmh2)-1 Mpc (observe Wmh) * Free-stream length : 80 (M/eV)-1 Mpc (Wm h2 = M / 93.5 eV) * Acoustic horizon : sound speed < c/31/2 * Silk damping M sets damping scale - reduced power rather than cutoff if DM is mixed Generally assume adiabatic Transfer function Parameters: WdWbWvWneutrino h w n M
The universe according to CDM Bright galaxies today were assembled from fragments at high redshift
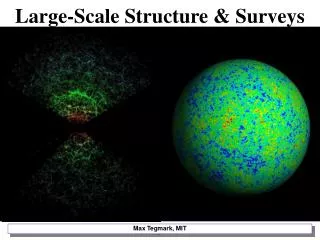
Results from the 2dF Galaxy Redshift Survey Target: 250,000 redshifts to B<19.45 (median z = 0.11) 250 nights AAT 4m time 1997-2002
Australia Joss Bland-Hawthorn Terry Bridges Russell Cannon Matthew Colless Warrick Couch Kathryn Deeley Roberto De Propris Karl Glazebrook Carole Jackson Ian Lewis Bruce Peterson Ian Price Keith Taylor BritainCarlton Baugh Shaun Cole Chris Collins Nick Cross Gavin Dalton Simon Driver George Efstathiou Richard Ellis Carlos Frenk Ofer Lahav Stuart Lumsden Darren Madgwick Steve Maddox The 2dFGRS Team Stephen Moody Peder Norberg John Peacock Will Percival Mark Seaborne Will Sutherland Helen Tadros 33 people at 11 institutions
2dFGRS input catalogue • Galaxies: bJ 19.45 from revised APM • Total area on sky ~ 2000 deg2 • 250,000 galaxies in total, 93% sampling rate • Mean redshift <z> ~ 0.1, almost all with z < 0.3
2dFGRS geometry ~2000 sq.deg. 250,000 galaxies Strips+random fields ~ 1x10⁸ h-3 Mpc3 Volume in strips ~ 3x10⁷ h-3 Mpc3 NGP SGP NGP 75x7.5 SGP 75x15 Random 100x2Ø ~70,000 ~140,000 ~40,000
Prime Focus The 2dF site
Final 2dFGRS Sky Coverage NGP SGP Final redshift total: 221,283
2dFGRS Redshift distribution • N(z) Still shows significant clustering at z < 0.1 • The median redshift of the survey is <z> = 0.11 • Almost all objects have z < 0.3.
2dFGRS power-spectrum results Dimensionless power: d (fractional variance in density) / d ln k Percival et al. MNRAS 327, 1279 (2001)
Confidence limits Wmh = 0.20 ± 0.03 Baryon fraction = 0.15 ± 0.07 ‘Prior’: h = 0.7 ± 10% & n = 1
Model fits: Feb 2001 vs ‘final’ Wmh = 0.20 ± 0.03 Baryon fraction = 0.15 ± 0.07 Wmh = 0.18 ± 0.02 Baryon fraction = 0.17 ± 0.06 if n = 1: or Wmh = 0.18 e1.3(n-1)
Conclusions from P(k) • Lack of oscillations. Must have collisionless component • CDM models work • Low density if n=1 and h=0.7 apply • possibilities for error: • Isocurvature? • W=1 plus extra ‘radiation’? • Massive neutrinos? • Scale-dependent bias? (assumed dgalsdmass)
Photometric recalibration Start with SuperCosmos UKST scans SDSS overlap in 33 equatorial plates: rms D = 0.09 mag ( = D SDSS-MGC ) Force uniform optical and opt-2MASS colours: rms linearity and ZP corrections 1.4% and 0.15 mag Calibration good to <1% and <0.03 mag recalibrate APM (rms 0.14 mag)
2dFGRS in COLOUR passive R magnitudes from SuperCosmos active Rest-frame colour gives same information as spectral type, h, but to higher z
Clustering as f(L) Clustering increases at high luminosity: b(L) / b(L*) = 0.85 + 0.15(L/L*) suggests << L* galaxies are slightly antibiased - and IRAS g’s even more so: b = 0.8
Redshift-space distortions and galaxy type • Passive: • = m0.6/b = 0.46 0.13 p =618 50 km s-1 • Active: • = m0.6/b = 0.54 0.15 p =418 50 km s-1 Consistent with Wm = 0.26, bpassive = 1.2, bactive = 0.9
Power spectrum and galaxy type shape independent of galaxy type within error on spectrum
Radial luminosity bias high z high L high b large-scale power too high? Extra radial weight: d d X < b(r) > < b(z) > = 0.85 + 6 z1.75 (factor 1.6 from z=0 to z=0.25) new window function Effect is Dn = 0.005
Relation to CMB results curvature baryons total density Combining LSS & CMB breaks degeneracies: LSS measures Wmh only if power index n is known CMB measures n and Wmh3 (only if curvature is known)
2dFGRS + CMB: Flatness CMB alone has a geometrical degeneracy: large curvature is not ruled out Adding 2dFGRS power spectrum forces flatness: | 1 - Wtot | < 0.04 Efstathiou et al. MNRAS 330, L29 (2002)
Detailed constraints for flat models(CMB + 2dFGRS only: no priors) Preferred model is scalar-dominated and very nearly scale-invariant Percival et al. MNRAS 337, 1068 (2002)
likelihood contours pre-WMAP + 2dFGRS 147024 gals scalar only, flat models
likelihood contours post-WMAP + 2dFGRS 147024 gals scalar only, flat models - WMAP reduces errors by factor 1.5 to 2
likelihood contours post-WMAP + 2dFGRS 213947gals scalar only, flat models
Effect of neutrinos Wn=0.05 Free-stream length: 80 (M/eV)-1 Mpc (Wm h2 = M / 93.5 eV) M ~ 1 eV causes lower power at almost all scales, or a bump at the largest scales
Neutrino mass limit Degeneracy: higher neutrino mass resembles lower Wh, so true Wh can be higher Needs a prior: for W < 0.5, limit is fn < 0.13, or Mn < 0.6 eV (assuming degenerate mass hierarchy) Elgaroy et al. PRL 89, 061301 (2002)
Vacuum equation of state (P = w rc2) w shifts present horizon, so different Wm needed to keep CMB peak location for given h w < - 0.54 similar limit from Supernovae: w < - 0.8 overall 2dFGRS
Extra relativistic components? Matter-radiation horizon scale depends on matter density (Wmh2) and relativistic density (=1.68 rCMB for 3 light neutrinos). Suppose rrel = X (1.68 rCMB ) so apparent Wmh = Wmh X-1/2 and Wm=1 h=0.5 works if X=8 But extra radiation affects CMB too. Maintaining peak location needs h=0.5X1/2 if Wm=1 If w=-1, 2dFGRS+CMB measureh X-1/2 = 0.71 +- 5% with HST h = 0.72 +- 11%, hence 1.68X = 1.70 +- 0.24 (3.1 +- 1.1 neutrinos)
Summary • >10 Mpc clustering in good accord with LCDM • power spectrum favours Wm h= 0.18 & 17% baryons • CMB + 2dFGRS implies flatness • CMB + Flatness measures Wm h3.4 = 0.078 • hence h = 0.71 ± 5%, Wm = 0.26 ± 0.04 • No evidence for tilt (n = 0.96 +- 0.04) or tensors • But large tensor fractions not yet strongly excluded • Neutrino mass <0.6 eV if Wm =1 excluded • w < - 0.54 by adding HST data on h (agrees with SN) • Boosted relativistic density cannot save Wm =1 • Neutrino background detected if w = -1 • Data public: http://www.mso.anu.edu.au/2dFGRS/Public