Aircraft Certification Methodology Overview
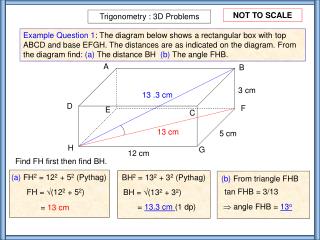
Detailed overview of aircraft certification methodology, reflecting on data sets and issues encountered during flight tests for TPAWS application. Includes comparison with turbulence models and flight data. Update on budget and progress milestones.

Aircraft Certification Methodology Overview
E N D
Presentation Transcript
TPAWS Certification Data Sets Box-1 Activity Fred H. Proctor, James F. Watson, and David W. Hamilton NASA Langley Research Center Bob Sharman and John Williams NCAR and George Switzer RTI ATDS Workshop #5, September 19-20, 2002 Long Beach, CA
Outline • Certification Methodology • Delivered Model Data Sets • -- Dickinson • -- Event 191-06 • Issues • -- Isotropy vs Anisotropy • -- Limited Sample Size • Comparison with VK-Turbulence • Comparison with Flight Data • Summary
FY02 TPAWS Certification MethodologyOverview • TPAWS Milestone#17 specifically relating to Certification was added to the FY02 WxAP Level-2 Plan; action from Workshop#3. • Developed and began implementation of the 6-box chart “Certification Methodology”, 25-Sep-01. • FY02 budget augmentation was requested and denied. • Prioritized Boxes 1, 2,3, 6-Flight Deck. • Prelim status report, actions from Workshop#4. • Small mid-year budget “ear-mark” for Box 4 weight issues, and Box 6 Scoring rules. JFW
FY02 TPAWS Certification MethodologyOverview • While a high priority in FY02, 757 Flight Campaign and resulting data analyses pushed back some efforts. • Also, budget increase was not as large as requested and came at mid-year. • Milestone#17 was slipped into FY03 and based upon AvSp/WxAP milestone adjustments will roll-up into another new Lvl-2 milestone in FY03/04. • Certification is FY03 top priority for TPAWS, • General “planned” TPAWS budget increases slightly over FY02. • FY03 757 WxAP Flight Campaign has been de-scoped. JFW
Certification Methodology Aircraft track Reflectivity, wind in radar volume 3d grid volume Simulated cloud NCAR
+ Cloud model grid Von Karman turbulence grid Simulation Methodology • Use cloud models to simulate winds and reflectivity • High resolution difficult to obtain while resolving the volume around a large cloud • Sub-volume selected which encompasses turbulence event • Von Karman representation of turbulence assumed for small scales not resolved by cloud model • Fine-grid turbulence generated by locally modulating the von Karman intensities by the large-scale resolved motion
Data Set Analysis/Hazard MetricFor any horizontal plane in the TASS data set, a w is computed using a moving average as: where the averaging interval is Lx=Ly = 1000 m, w is vertical wind, and
Data Set Analysis (continued) Substitute u(x,y) and v(x,y) for w to get u andv , respectively. For a particular aircraft, RMS normal load can be estimated from w using look-up tables; i.e., ng(x,y) = F{w , altitude, aircraft type, weight, airspeed}
Two Model Data Sets Available • Dickinson ND • Severe turbulence encountered by B-757 at 11 km AGL on 10 July 1997 • Event 191-06 • Severe turbulence encountered at 10.3 km AGL on 14 Dec 2000 during NASA’s TPAWS flight tests
DICKINSON SIMULATION -- DATA SET • Physical domain size and vertical location • 14,196 x 14,196 meters horizontally • 6183.75 meters vertically starting at 7700 meters AGL • Number of grid points • 512 x 512 horizontally • 256 vertically • Grid resolution • 27.78 meters in both horizontal directions • 24.25 meters in vertical direction • Variables • U, V, W, and radar reflectivity factor
Y (km) Y (km) X (km) X (km) Horizontal Cross-Section of Dickinson Data Set radar reflectivity RMS acceleration from dBZ 11 km elevation RMS G dBZ 8 km elevation RMS G GFS/FHP 9/2002
radar reflectivity Y (km) Y (km) X (km) X (km) Horizontal Cross-Section of Dickinson Data Set 11 km elevation dBZ m/s m/s m/s GFS/FHP 9/2002
Horizontal Cross-Section of Dickinson Data Set 8 km elevation radar reflectivity dBZ Y (km) m/s Y (km) m/s m/s GFS/FHP 9/2002 X (km) X (km)
EVENT 191-6 SIMULATION -- DATA SET • Physical domain size and vertical location • 12,775 x 12,775 meters horizontally • 3175 meters vertically starting at 7700 meters AGL • Number of grid points • 512 x 512 horizontally • 128 vertically • Resolution • 25 meters in all coordinate directions • Variables • U, V, W, and radar reflectivity factor
TASS Simulation of Convective Lineviewed from southeast(cloud/precipitation surfaces)
Y (km) Y (km) X (km) X (km) Horizontal Cross-Section of FLR 191-6 Data Set radar reflectivity RMS acceleration from dBZ 10.3 km elevation RMS G dBZ 8.3 km elevation GFS/FHP 9/2002
Y (km) Y (km) X (km) X (km) Horizontal Cross-Section of FLR 191-6 Data Set 10.3 km elevation radar reflectivity dBZ m/s m/s m/s GFS/FHP 9/2002
Horizontal Cross-Section of FLR 191-6 Data Set 8.3 km elevation radar reflectivity dBZ Y (km) m/s Y (km) m/s m/s GFS/FHP 9/2002 X (km) X (km)
Example: Isotropy in simulation • These spectra, derived from a N-S path near the “hotspot” in the NASA 191-06 simulation, are nearly isotropic: ¾Sw = 1.1 Su NCAR
Example: Anisotropy in simulation • These spectra, from a N-S path near the “hotspot” in the NASA 191-06 simulation, yield an anisotropic ratio similar to the aircraft flight results: ¾Sw = 2.2 Su NCAR
Example: NASA 191-06 test flight • These spectra are anisotropic: ¾Sw = 2.1 Su . NCAR
Von Karman Data Set Input: = 4.2 m/s, L = 500 m • Physical domain size and vertical location • 12,775 x 12,775 meters horizontally • 3175 meters vertically • Number of grid points • 512 x 512 horizontally • 128 vertically • Grid Resolution • 25 meters in all coordinate directions • Variables • U, V, and W
Horizontal Cross-Section of Von-Karman Data Set RMS G Y (km) m/s Sample Path Y (km) m/s m/s GFS/FHP 9/2002 X (km) X (km)
Flight Path Through Von-Karman Data Set RMS G GFS/FHP 9/2002 Distance (km)
Flight Path Through Von-Karman Data Set Local Standard Deviation (m/s) GFS/FHP 9/2002 Distance (km)
Summary • Model + subgrid merger completed for NASA 191-06 and Dickinson turbulence encounters • Results of model + subgrid appear reasonable and are supported by flight data • The statistical variability of single events is large • Local correlation between sigma-u and sigma-w affected by anisotropy and event size