Twin Groups’ Experience
This report presents a comprehensive analysis of student satisfaction within the Twin Groups in 2013. It explores percentages of students who were totally, very, and quite happy with their overall Twin experience, including their willingness to recommend Twin to friends. Additionally, it examines satisfaction levels regarding teachers, course materials, progress, and the effectiveness of e-learning and the Self-Study Centre. Finally, our findings also highlight student happiness with the social programme, providing valuable insights into areas of success and improvement.

Twin Groups’ Experience
E N D
Presentation Transcript
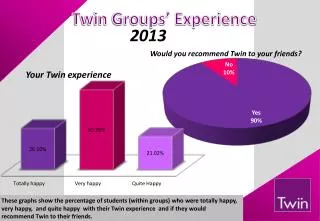
Twin Groups’ Experience 2013 Would you recommend Twin to your friends? Your Twin experience These graphs show the percentage of students (within groups) who were totally happy, very happy, and quite happy with their Twin experience and if they would recommend Twin to their friends.
Happy Students in Groups’ 2013 This graph shows the percentage of students (within groups) who were totally happy, very happy and quite happy with their learning experience (teacher, course book/ materials, progress).
Twin e-Learning (TeL) and Self-Study Centre - Groups 2013 This graph shows the percentage of students (within groups) who were totally happy, very happy, and quite happy with TeL and the Self-study centre.
Social Programme - Groups 2013 This graph shows the percentage of students (within groups) who were totally happy, very happy, or quite happy with the social programme.