Download
1 / 51
510 likes | 616 Views
Explore the impact of Moist Processes on Weather, Water Cycles, and Climate Feedback. Investigate convection patterns and interactions with large-scale circulations in tropical regions using physical principles. Study the relation between precipitation and SST using cloud-resolving models to gain insights. Analyze convective processes and column relative humidity for climate modeling. Investigate the influence of SST on vertical motions and feedback in the West Pacific and East Pacific regions for a comprehensive understanding.

E N D
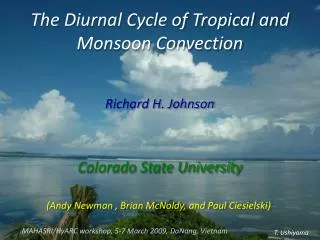
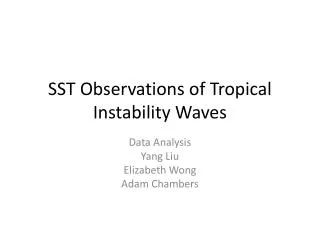
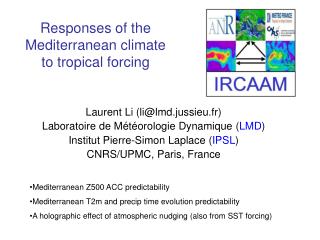
Responses of tropical convection to changes in SST and imposed drying Shuguang Wang Columbia University
Moist processes: essential for weather, critical component of the water cycles, influence radiative balance, feedback to climate change • Substantial gap between convective weather and climate Moist processes
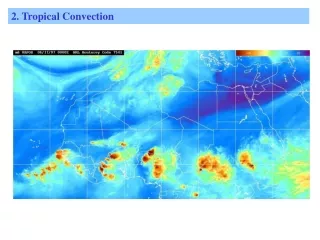
Many open questions about tropical convection, e.g., • Intensity • Frequency • Organization/Self-organization • Interaction with large scale circulations/waves • Similarity/dissimilarity to Mid-latitude severe storms • Convective parameterization in climate models Tropical Convection Can we use well-established physical principles to gain some understanding?
A diagnostic relationship: Balance constraint in tropics? Vertical Velocity x Stability = Diabatic heating adiabatic cooling = Radiative cooling and convective heating Horizontal advection is not important, because temperature gradient in free troposphere is small in tropics. Weak temperature gradient (WTG) approximation (Sobel and Bretherton 2000, Bretherton and Sobel 2003) Convection is constrained by this constraint beyond convective time scales
Temperature at 500 hPa Observations of January climatology SST • Climatology: • Temperature is much more uniform in tropics than in midlatitudes • Free tropospheric temperature is homogeneous. • SST (sea surface temperature) have much more structures.
Why temperature in tropics is uniform? In a stratified fluid, a localized temperature anomaly will spread out in the form of gravity waves, until it reaches the deformation radius x time T Ld t >Ld/c t=0 At the equator, the effective deformation radius of the atmosphere is ~1500 km in latitude, and the entire circumference of the earth in longitude. In ocean, the deformation radius is one magnitude smaller.
SST Observations of January climatology Daily Rain • Climatology: • SST and precipitation resemble each other
Outgoing long wave radiation Observational relation between Precipitation and SST Waliser et al. 1993 At first order, there is a monotonic relationship between SST and Precipitation Can we actually compute this statistical relationship to gain some understanding using a cloud resolving model?
Do numerical models “know” the WTG constraint? Limited area models do NOT know, if it convers areas smaller than deformation radius Temperature in free troposphere is relaxed to the mean, achieved at tropical mean SST, (Here 28oC) Large scale vertical motion Transport water vapor vertically Convection Large scale vertical motion Two-way Feedback
WRF model (Weather Research and Forecast model V3.0) Full physics but with simple radiative cooling: constant 1.5K/day cooling in the troposphere (Pauluis and Garner 2006) Modeling statistical relation between convection and SST in a small area at dx = 2 km Monthly long cloud system resolving experiments to statistical equilibrium 22 km 192 km 192 km Wang and Sobel 2011, JGR
Snapshots of rain rate in a cloud-resolving model (WRF) SST=28oC SST=30oC At 28oC: mostly random, grid point convection At 30oC: intensify, organized, longer duration
Time series of daily and hourly rain rate at SST = 28 and 30 SST = 30 oC SST = 28 oC
Precipitation and surface fluxes in 3D WRF experiments Each dot represents one statistically steady solution
Precipitation and surface fluxes in 3D vs. 2D Rain is much higher in 2D than 3D, but surface fluxes are not Why? Energy dispersion, Entrainment rate, Cloud base buoyance, etc.
Rain and column relative humidity Column-integrated water vapor column relative humidity: Column-integrated saturated water vapor P (mm/day) column relative humidity Combine all experiments with different SSTs: compact relationship between rain and column relative humidity
Rain and column relative humidity P (mm/day) Bretherton et al 2004 Observations also show a compact relationship between rain and column relative humidity
Rain and column relative humidity at equilibrium Transient P (mm/day) Equilibrium P (mm/day) Negative correlation between P and CRH suggests a negative feedback
Vertical structure of temperature change 2 K warming 2K SST increase => troposphere warm by 1.5 K < SST increase
Large scale vertical motion Large scale vertical motion: maximize in upper troposphere Predominantly top heavy Implies convergent inflow below and divergent outflow above
Large scale vertical motion • Large scale vertical motion • Predominantly top heavy • Self-similar in shape
Large scale vertical motion Cloud mass fluxes Convective mass fluxes also become top-heavy at higher SST Large scale vertical motion Feedback Convection
Large scale vertical motion West Pacific warm pool Vertical motions binned by P 140-160E, 7-7.5 N Back and Bretherton 2006 Large scale vertical motion: top heavy Broadly consistent with Omega in west pacific in ERA40 analysis data
East Pacific ITCZ West Pacific warm pool Vertical motions binned by P Vertical motions binned by P 140-160E, 7-7.5 N 120-140 W, 7.5-10 N Back and Bretherton 2006 • Large scale vertical motion in ERA40 analysis data • Bottom heavy in east Pacific • Top heavy in west Pacific
Meridional circulation in East pacific ITCZ Zhang et al. 2008 • Possible mechanisms: • Ascending branch of large-scale “sea breeze” (Nolan et al. 2007, 2010) • Dry intrusion due to transients (Zuidema et al. 2006, Peters et al. 2008)
Explore the impact of drying on large scale vertical motion We can use the cloud-resolving model to understand the impact of drying But these are no SST gradient Equation for water vapor Drying time scale τq is inversely proportional to drying strength Large τq : drying is relatively small τqis constrained physically by the availability of water vapor in the column Wang and Sobel 2011, to be submitted
Explore the impact of drying on vertical motion Equation for water vapor Drying time scale τq is physically limited by the available water vapor in the column
Impose drying at three levels Upper troposphere Middle troposphere Lower troposphere
Precipitation due to imposed drying Drying time scale τq (days) Drying at lower levels are most closely tied to convective activities Drying at upper troposphere has little impact on precipitation
Large scale vertical motion Drying at low levels Drying at middle levels
Time evolution of large scale vertical velocity • With a short time scale, drying at low levels can lead to bottom-heavy large scale vertical motion
Drying leads to bottom-heavy profiles • With a short time scale, drying at low levels can lead to bottom-heavy large scale vertical motion • Entrainment of dry air?
Export of moist static energy export and drying time scale Moist static energy: h = Cp·T+g·Z+Lv·Q Energy export (W/m2) Drying time scale - Energy export and drying time scale well correlated - Interpret these results from an energetic perspective
An energetic perspective Moist static energy: h = Cp·T+g·Z+Lv·Q Net export Net import Top-heavy, deep circulation: export energy Bottom heavy, shallow circulation: import energy
Energy budget: without drying 150 W/m2 170 W/m2 320 W/m2
Energy budget: short drying time scale 150 W/m2 160 W/m2 Drying 40 W/m2 270 W/m2 • Drying induced energy loss • Circulation has to adjust to compensate energy loss => shallow circulation
A cloud system resolving model has been used to probe the responses of tropical convection to the SST forcing and drying forcing • Rain increases monotonically with SST; Compact relationship between rain and column relative humidity; Broadly consistent with observations • Large scale vertical motions are predominantly top-heavy, as found in west Pacific warm pool, but not in east Pacific ITCZ • Drying can cause variations of large scale vertical motion: sufficient drying leads to bottom-heavy vertical motions • Energetic perspective provides some understanding of the top-heaviness and bottom-heaviness of large scale vertical motions Summary
High resolution numerical models are powerful tools to study tropical convection • WTG thinking can be very useful for understanding of convective dynamics and its interaction with large scale circulations • Many unresolved issues on tropical convections • e.g., frequency, diurnal cycles, • convection over land versus ocean • weather – climate connections Concluding remark
Midlatitude moist baroclinic waves(5 km resolution) How to understand the impact of moist processes on midlatitude eddies?
How a numerical model “knows” the balanced constraint? Limited area models do NOT know. As SST is changed, temperature in free troposphere is relaxed to the mean, achieved at some SST, e.g., 28C Large scale vertical motion is used to advect water vapor Large scale vertical motion Convection Two-way Feedback
Impose the dynamical constraint in a numerical model Holding temperature in free troposphere close to temperature at mean SST, e.g., 28C Large scale vertical motion SST=30oC SST=28oC SST=28oC Radiative-convective equilibrium SST=27oC Impose new SST to achieve new equilibrium
2D versus 3D Tompkins 2000
Large scale vertical motion Vertical motions binned by P West Pacific warm pool 140-160E, 7-7.5 N Back and Bretherton 2006 Large scale vertical motion: maximize in upper troposphere, top heavy Broadly consistent with Omega in west pacific in ERA40 analysis data
How to understand them? Drying Moist static energy budget: Surface fluxes = Radiation cooling +energy export by circulation
How to understand them? Deep circulation: export energy Shallow circulation: import energy Drying Surface fluxes = Radiation cooling +energy export by circulation + Drying
How to understand them? Deep circulation: export energy Shallow circulation: import energy Surface fluxes = Radiation cooling + Drying + energy import/export by circulation Drying
Why bottom-heavy in East pacific ITCZ region? Sharp SST gradient • Possible mechanisms: • Dry intrusion due to transients (Sobel 2006, Peters et al. 2008) • Ascending branch of large-scale “sea breeze” (Nolan et al. 2007, 2010)
Relative sea surface temperature: SST relative to the tropical mean SST Relative SST: an simple yet powerful index for climatology of hurricane, an extreme case of organized tropical convection Tropical convection and sea surface temperature (SST)
An energetic perspective Moist static energy: h = Cp·T+g·Z+Lv·Q Net export Net import Top-heavy, deep circulation: export energy Bottom heavy shallow circulation: import energy