Download
1 / 66
680 likes | 944 Views
Scale Interactions in Organized Tropical Convection. George N. Kiladis Physical Sciences Division ESRL, NOAA. Why Study Tropical Convective Variability?. Tropical Convection acts as a primary “heat engine†for the atmospheric circulation

E N D
Scale Interactions in Organized Tropical Convection George N. Kiladis Physical Sciences Division ESRL, NOAA
Why Study Tropical Convective Variability? Tropical Convection acts as a primary “heat engine” for the atmospheric circulation Variability in tropical convection has global scale impacts over a variety of time scales Convection is coupled to the ocean within the tropics >Sea surface temperature has a strong influence >Atmospheric disturbances influence SST
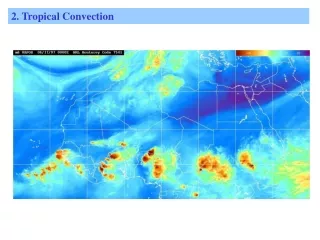
OBSERVATIONS OF WAVES WITHIN THE MJO Time–longitude diagram of CLAUS Tb (5S–equator), February 1987
The Madden-Julian Oscillation (MJO) Discovered by Rol Madden and Paul Julian at NCAR in 1971 Characterized by an envelope of convection ~10,000 km wide moving eastward at around 5 m/s Most active over regions of high sea surface temperature (> 27 C) Can have a profound impact on the extratropical circulation Is poorly represented in general circulation models, if at all Composed of a variety of higher frequency, smaller scale disturbances
Shallow Water System (Matsuno, 1966) is the meridional gradient of f at the eq where is the equivalent depth is the gravity wave speed
Theoretical Dispersion Relationships for Shallow Water Modes on Eq. Plane Frequency Zonal Wavenumber
Theoretical Dispersion Relationships for Shallow Water Modes on Eq. Plane Inertio-Gravity Kelvin Frequency Equatorial Rossby Zonal Wavenumber
Kelvin Wave Theoretical Structure Wind, Pressure (contours), Divergence, blue negative
Mixed Rossby-Gravity Wave Theoretical Structure Wind, Pressure (contours), Divergence, red negative
Wavenumber-Frequency Spectral Analyis Decompose into Symmetric and Antisymmetric Fields about the Equator Complex Fourier Transform into wavenumber space at each latitude FFT of each wavenumber into frequency space Average the Power for each wavenumber/frequency by latitude Determine “background” spectrum by smoothing raw spectra Divide raw spectra by background spectra to determine signals standing above the background
OLR power spectrum, 15ºS-15ºN, 1979–2001 (Symmetric) from Wheeler and Kiladis, 1999
OLR power spectrum, 15ºS-15ºN, 1979–2001 (Symmetric) 1.25 Days Westward Power Eastward Power 96 Days from Wheeler and Kiladis, 1999
OLR power spectrum, 15ºS-15ºN, 1979–2001 (Antisymmetric) from Wheeler and Kiladis, 1999
OLR background spectrum, 15ºS-15ºN, 1979–2001 from Wheeler and Kiladis, 1999
OLR power spectrum, 1979–2001 (Symmetric) from Wheeler and Kiladis, 1999
OLR power spectrum, 1979–2001 (Symmetric) Westward Inertio-Gravity Kelvin Equatorial Rossby Madden-Julian Oscillation from Wheeler and Kiladis, 1999
OLR power spectrum, 1979–2001 (Antisymmetric) from Wheeler and Kiladis, 1999
OLR power spectrum, 1979–2001 (Antisymmetric) Eastward Inertio-Gravity Mixed Rossby-Gravity from Wheeler and Kiladis, 1999
MJO (5 m s-1) OBSERVATIONS OF KELVIN WAVES AND THE MJO Time–longitude diagram of CLAUS Tb (2.5S–7.5N), January–April 1987 Kelvin waves (15 m s-1)
OBSERVATIONS OF KELVIN AND MRG WAVES Time–longitude diagram of CLAUS Tb (2.5S–7.5N), May 1987
Kelvin Wave Theoretical Structure Wind, Pressure (contours), Divergence, blue negative
OLR power spectrum, 1979–2001 (Symmetric) from Wheeler and Kiladis, 1999
Regression Models Simple Linear Model: y = ax + b where: x= predictor (filtered OLR) y= predictand (OLR, circulation)
OLR and 1000 hPa Flow Regressed against Kelvin-filtered OLR (scaled -20 W m2) at 10N, 150W for June-Aug. 1979-2004 Day 0 Geopotential Height (contours 2 m) Wind (vectors, largest around 5 ms-1) OLR (shading starts at +/- 6 W s-2), negative blue
OLR and 1000 hPa Flow Regressed against Kelvin-filtered OLR (scaled -20 W m2) at 10N, 150W for June-Aug. 1979-2004 Day-6 Geopotential Height (contours 2 m) Wind (vectors, largest around 5 ms-1) OLR (shading starts at +/- 6 W s-2), negative blue
OLR and 1000 hPa Flow Regressed against Kelvin-filtered OLR (scaled -20 W m2) at 10N, 150W for June-Aug. 1979-2004 Day-5 Geopotential Height (contours 2 m) Wind (vectors, largest around 5 ms-1) OLR (shading starts at +/- 6 W s-2), negative blue
OLR and 1000 hPa Flow Regressed against Kelvin-filtered OLR (scaled -20 W m2) at 10N, 150W for June-Aug. 1979-2004 Day-4 Geopotential Height (contours 2 m) Wind (vectors, largest around 5 ms-1) OLR (shading starts at +/- 6 W s-2), negative blue
OLR and 1000 hPa Flow Regressed against Kelvin-filtered OLR (scaled -20 W m2) at 10N, 150W for June-Aug. 1979-2004 Day-3 Geopotential Height (contours 2 m) Wind (vectors, largest around 5 ms-1) OLR (shading starts at +/- 6 W s-2), negative blue
OLR and 1000 hPa Flow Regressed against Kelvin-filtered OLR (scaled -20 W m2) at 10N, 150W for June-Aug. 1979-2004 Day-2 Geopotential Height (contours 2 m) Wind (vectors, largest around 5 ms-1) OLR (shading starts at +/- 6 W s-2), negative blue
OLR and 1000 hPa Flow Regressed against Kelvin-filtered OLR (scaled -20 W m2) at 10N, 150W for June-Aug. 1979-2004 Day-1 Geopotential Height (contours 2 m) Wind (vectors, largest around 5 ms-1) OLR (shading starts at +/- 6 W s-2), negative blue
OLR and 1000 hPa Flow Regressed against Kelvin-filtered OLR (scaled -20 W m2) at 10N, 150W for June-Aug. 1979-2004 Day 0 Geopotential Height (contours 2 m) Wind (vectors, largest around 5 ms-1) OLR (shading starts at +/- 6 W s-2), negative blue
OLR and 1000 hPa Flow Regressed against Kelvin-filtered OLR (scaled -20 W m2) at 10N, 150W for June-Aug. 1979-2004 Day+1 Geopotential Height (contours 2 m) Wind (vectors, largest around 5 ms-1) OLR (shading starts at +/- 6 W s-2), negative blue
OLR and 1000 hPa Flow Regressed against Kelvin-filtered OLR (scaled -20 W m2) at 10N, 150W for June-Aug. 1979-2004 Day+2 Geopotential Height (contours 2 m) Wind (vectors, largest around 5 ms-1) OLR (shading starts at +/- 6 W s-2), negative blue
Mixed Rossby-Gravity Wave Theoretical Structure Wind, Pressure (contours), Divergence, red negative
OLR and 850 hPa Flow Regressed against MRG-filtered OLR (scaled -40 W m2) at 7.5 N, 172.5E, 1979-2004 Day-1 Streamfunction (contours 2 X 10⁵ m2 s-1) Wind (vectors, largest around 2 ms-1) OLR (shading starts at +/- 6 W s-2), negative blue
Temperature Structure of a Dry Kelvin Wave Direction of Motion W C W C
Temperature Structure of a Dry Kelvin Wave Direction of Motion W C W C
Temperature at Majuro (7N, 171E) Regressed against Kelvin-filtered OLR (scaled -40 W m2) for 1979-1999 OLR (top, Wm-2) Temperature (contours, .1 °C), red positive from Straub and Kiladis 2002
Zonal Wind at Majuro (7N, 171E) Regressed against Kelvin-filtered OLR (scaled -40 W m2) for 1979-1999 OLR (top, Wm-2) Zonal Wind (contours, .25 ms-1), red positive from Straub and Kiladis 2002
Specific Humidity at Majuro (7N, 171E) Regressed against Kelvin-filtered OLR (scaled -40 W m2) for 1979-1999 OLR (top, Wm-2) Specific Humidity (contours, 1 X 10⁻¹ g kg-1), red positive from Straub and Kiladis 2002
Meridional Wind at Majuro (7N, 171E) Regressed against MRG-filtered OLR (scaled -40 W m2) for 1979-1999 OLR (top, Wm-2) Meridional Wind (contours, .25 ms-1), red positive
Temperature at Majuro (7N, 171E) Regressed against MRG-filtered OLR (scaled -40 W m2) for 1979-1999 OLR (top, Wm-2) Temperature (contours, .1 °C), red positive
Specific Humidity at Majuro (7N, 171E) Regressed against MRG-filtered OLR (scaled -40 W m2) for 1979-1999 OLR (top, Wm-2) Specific Humidity (contours, 1 X 10⁻¹ g kg-1), red positive
Wave Motion Haertel and Kiladis 2004
Wave Motion Haertel and Kiladis 2004
Wave Motion Haertel and Kiladis 2004
Wave Motion Haertel and Kiladis 2004
Zonal Wind at Honiara (10S, 160E) Regressed against MJO-filtered OLR (scaled -40 W m2) for 1979-1999 OLR Pressure (hPa) OLR (top, Wm-2) U Wind (contours, .5 ms-1), red positive from Kiladis et al. 2005