Download
1 / 12
120 likes | 322 Views
An alysis o f Va riance (ANOVA). ANOVA. More than two samples Can test multiple factors at the same time Multiple-way ANOVA One factor: One-way ANOVA E.g. Are there any difference of the heights of students from class A, B, C and D? Two factors: Two-way ANOVA

E N D
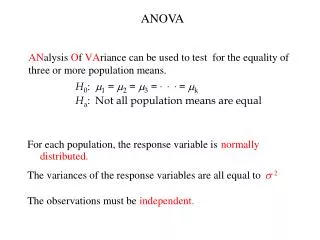
ANOVA • More than two samples • Can test multiple factors at the same time • Multiple-way ANOVA • One factor: One-way ANOVA • E.g. Are there any difference of the heights of students from class A, B, C and D? • Two factors: Two-way ANOVA • E.g. Are there any difference of the heights of students from class A, B, C and D and also between the sexes?
Assumptions for ANOVA • Normal distribution • Homogeneity of variances Most important! Otherwise, you have to use non-parametric Kruskal-Wallis test
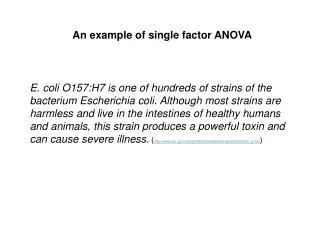
An example (Lab 5, e.g. 6) • Four dietary treatments applied to the snails • Measurement: shell length
2. Test for homogeneity of variances Ho: equal variances Ha: unequal variances Fmax test 1 Fmax = Varmax / Varmin = 4.6 / 3.5 = 1.3143 Calculated Fmax < Critical F0.05(2),5,5 = 7.15 Accept Ho Equal variances (p>0.05)
2. Test for homogeneity of variances Ho: equal variances Ha: unequal variances Fmax test 2 Calculated F = 1.3143 Critical F0.05(2),5,5 = 7.15 Accept Ho Equal variances (p>0.05)
i-1 n-1 3. One-way ANOVA Ho: equal mean among the diets Ha: unequal mean among the diets Cal F > Crit F, p<0.05 Reject Ho, unequal means
In SPSS, 1. Plot a bar chart
2. One-way ANOVA 2 1 3 Only SPSS allows post-hoc Tukey test 4
a b a a