Download
1 / 5
50 likes | 153 Views
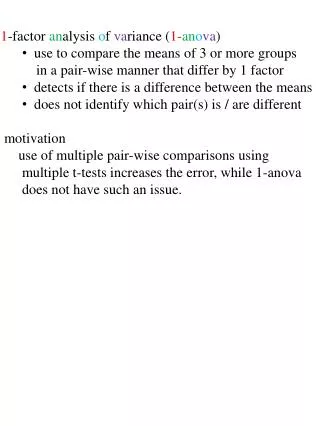
1 -factor an alysis o f va riance ( 1- an o va ) use to compare the means of 3 or more groups in a pair-wise manner that differ by 1 factor detects if there is a difference between the means does not identify which pair(s) is / are different motivation

E N D
1-factor analysis of variance (1-anova) • use to compare the means of 3 or more groups • in a pair-wise manner that differ by 1 factor • detects if there is a difference between the means • does not identify which pair(s) is / are different • motivation • use of multiple pair-wise comparisons using • multiple t-tests increases the error, while 1-anova • does not have such an issue.
Basis: • use F-test to compare 2 estimates of the variance • MS(Tr): based on the SEM • MSE: find the average of the SD2 from • each group • where • and • if the means are the same, then MS(Tr) would be • a valid estimate of the variance, SD2; otherwise, • the F-test should show that the 2 estimates of • the variance are different.
MS(Tr): estimate of SD2 based on the SEM. To simplify the analysis, assume all groups have the same sample size; if invalid assumption, then analysis is more complicated. recall, where SEM = standard deviation of the means; thus where k = # groups n = # samples in a group = mean of the ith group .. = mean of all samples
MSE: estimate of SD2 by averaging the SD2 of each group. To simplify the analysis, assume all groups have the same sample size; if invalid assumption, then analysis is more complicated. where k = # groups SDi2 = variance of the ith group n = # samples in a group = mean of the ith group = jth data in the ith group
Tukey test • use only if preceding 1-anova detects • a difference among the means • multiple (pair-wise) comparison test, • which identifies the pair(s) of different • means