Download
1 / 12
120 likes | 241 Views
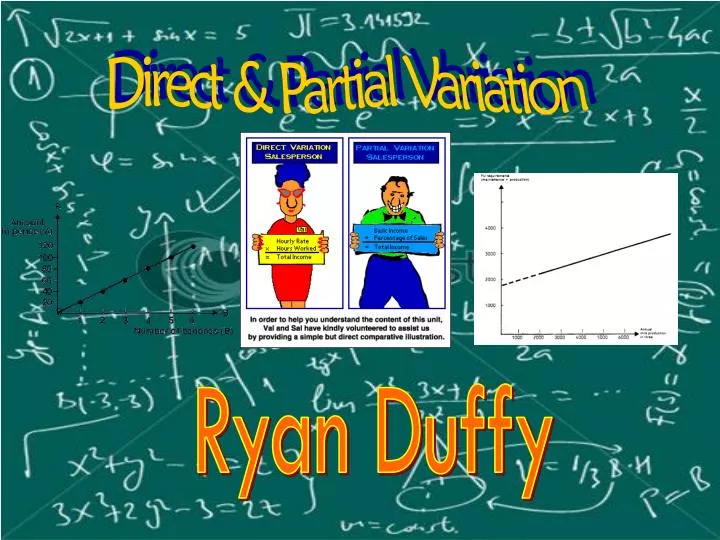
Direct & Partial Variation. Ryan Duffy. Direct Variation. A relationship between two variables in which one variable is a constant multiple of the other. When graphing the line DOES pass through the origin. Represented by y=mx form X and Y values vary directly with each other.

E N D
Direct & Partial Variation Ryan Duffy
Direct Variation A relationship between two variables in which one variable is a constant multiple of the other. When graphing the line DOES pass through the origin. Represented by y=mx form X and Y values vary directly with each other
Partial Variation A relationship between two variables in which one variable is a constant multiple of the other plus a constant value. Graph DOES NOT pass through the origin. Represented by y=mx+b form
What does... y=mx & y=mx+b Mean? *y=mx and y=mx+b *Y is the unknown value *M is the slope or how much the line increases *B is the Y-intercept *X is the value on the X-axis
y=mx & y=mx+b Direct Variation Partial Variation y=mxM: is the constant of variation y=mx+bM: is the constant of variationB: is the fixed cost
Examples For Direct Variation Bubba earns 24.00$ per hour at his grandfathers donkey farm. Create a table of values that displays the money earned by Bubba in 6 hours. Example #1 Not real graph (example)
The relation for Bubba's graph displays the relationship between his hours worked and his wages. We can say that his wages vary directlywith the hours worked. This type of relation is known as a directvariation. If we examine the formula of his hours worked and his wages, we would get y=24x Therefore this is in the form of y=mx, so it is a Direct Variation
Examples for Partial Variation Example #1 Bubba gets a new job at his uncles lama farm. He now gets paid 9.00$ a day plus 27.00$ per hour create a table of values that displays the money Bubba earns at his new job. Not real graph ( Example)
The relation for Bubba's graph displays the new relationship between his hours worked and his wages with a fixed daily wage. We can say that his wages varypartiallywith the hours worked. This type of relation is known as a partialvariation. If we examine the formula of his hours worked and his wages, we would get y=27x+9 Therefore this is in the form of y=mx+b, which is a Partial Variation
The By Ryan Duffy End