Download
1 / 46
460 likes | 562 Views
Global Ocean Monitoring: Recent Evolution, Current Status, and Predictions. Prepared by Climate Prediction Center , NCEP March 8, 2011. http://www.cpc.ncep.noaa.gov/products/GODAS/ This project to deliver real-time ocean monitoring products is implemented

E N D
Global Ocean Monitoring: Recent Evolution, Current Status, and Predictions Prepared by Climate Prediction Center, NCEP March 8, 2011 http://www.cpc.ncep.noaa.gov/products/GODAS/ This project to deliver real-time ocean monitoring products is implemented by CPC in cooperation with NOAA's Office of Climate Observation (OCO)
Outline • Overview • Recent highlights • Pacific/Arctic Ocean • Indian Ocean • Atlantic Ocean • CFS SST Predictions
Overview • Pacific and Arctic Oceans • ENSO cycle: La Niña conditions weakened with NINO3.4=-1.2oC in Feb 2011. • NOAA/NCEP Climate Forecast System (CFS) suggests that the current La Niña is in a decay phase, and ENSO will be near neutral in the summer 2011. • PDO has been negative since Jun 2010, and weakened slightly since Jan 2011 with PDO index=-1.3 in Feb 2011. • Anomalous upwelling strengthened at 36ON-57ON along the west coast of North America in Feb 2011, leading to above-normal nutrient supply. • Artic sea ice extent was well below normal, and smaller than that of 2006-2007 since mid-Dec 2010. • Indian Ocean • SSTA was small negative. • Atlantic Ocean • After 16 month persistent negative phase (Oct 2009-Jan2011), NAO switched to positive phase with NAO index = 0.70 in Feb 2011. • Tripole SSTA pattern weakened in Feb 2011.
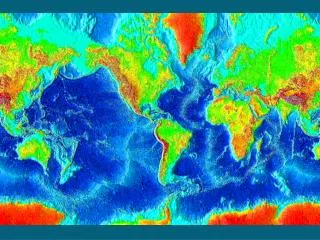
Global SST Anomaly (0C) and Anomaly Tendency Fig. G1. Sea surface temperature anomalies (top) and anomaly tendency (bottom). Data are derived from the NCEP OI SST analysis, and anomalies are departures from the 1981-2010 base period means. • La Nina conditions presented in the tropical central and eastern Pacific. • Negative PDO pattern was observed in N. Pacific. • A tripole SSTA pattern existed in North Atlantic. • Negative SSTA was small in the Indian Ocean. • Positive SSTA was seen in mid-latitude southern oceans. • Both La Nina conditions and negative PDO pattern weakened • Small positive SSTA tendency presented in the central tropical Indian Ocean. • Anomaly amplitude of the tripole SSTA pattern reduced in N. Atlantic. • Large SSTA tendency was observed over the mid-latitude southern oceans.
Be aware that new climatology (1981-2010) was applied since Jan 2011 1971-2000 SST Climatology (Xue et al. 2003): http://www.cpc.ncep.noaa.gov/products/predictions/30day/SSTs/sst_clim.htm 1981-2010 SST Climatology: http://origin.cpc.ncep.noaa.gov/products/people/yxue/sstclim/ • The seasonal mean SST in February-April (FMA) increased by more than 0.2oC over much of the Tropical Oceans and N. Atlantic, but decreased by more than 0.2oC in high-latitude N. Pacific, Gulf of Mexico and along the east coast of U.S. • Compared to FMA, the seasonal mean SST in August-October (ASO) has a stronger warming in the tropical N. Atlantic, N. Pacific and Arctic Ocean, and a weaker cooling in Gulf of Mexico and along the east coast of U.S.
Global SSH/HC Anomaly (cm/oC ) and Anomaly Tendency Fig. G2. Sea surface height anomalies (SSHA, top left), SSHA tendency (bottom left), top 300m heat content anomalies (HCA, top right), and HCA tendency (bottom right). SSHA are derived from http://www.aviso.oceanobs.com, and HCA from GODAS. • In the tropical Pacific Ocean, negative (positive) SSHA and HCA in the central and eastern (western) basin presented, but the anomalies along the equatorial central and eastern Pacific weakened significantly. • In the tropical Indian Ocean, positive (negative) SSHA and HCA in the eastern (central) basin weakened, which are probably associated with the weakening of the La Nina conditions. • In the high latitude of North Atlantic, positive SSHA and HCA weakened. • SSHA and HCA anomalies as well as their tendencies were largely consistent, except in the Southern Ocean where biases in GODAS climatology are large (not shown).
Longitude-Depth Temperature Anomaly and Anomaly Tendency in 2OS-2ON Fig. G3. Equatorial depth-longitude section of ocean temperature anomalies (top) and anomaly tendency (bottom). Data are derived from the NCEP's global ocean data assimilation system which assimilates oceanic observations into an oceanic GCM. Anomalies are departures from the 1982-2004 base period means. • Negative (positive) temperature anomalies dominated in the equatorial central and eastern (western) Pacific, consistent with the La Niña conditions. • - Negative (positive) temperature anomalies presented near the thermocline in the equatorial western (eastern) Indian Ocean. • Both positive and negative temperature anomalies observed cross the equatorial Atlantic Ocean. • Temperature increased across much of the equatorial Pacific, particularly between 180O-120OW, indicating the weakening tendency of the La Nina conditions. • Both positive and negative temperature anomaly tendencies presented in the equatorial Atlantic and Indian Oceans.
Evolution of Pacific NINO SST Indices Nino 4 Nino 3.4 Nino 1+2 Nino 3 • All NINO indices weakened, Nino1+2 was near zero. • The indices were calculated based on OISST. They may have some differences compared with those based on ERSST.v3b. Fig. P1a. Nino region indices, calculated as the area-averaged monthly mean sea surface temperature anomalies (oC) for the specified region. Data are derived from the NCEP OI SST analysis, and anomalies are departures from the 1981-2010 base period means.
NINO3.4 Heat Budget • Tendency (dT/dt) in NINO 3.4 (dotted line) has been positive since Jan 2011, indicating the weakening of La Nina. • All dynamical terms (Qu, Qv, Qw+Qzz) have been near zero in last two months. • The thermodynamic processes (Qq) was positive during Jun 2010-Jan 2011, and switched to negative in Feb 2011. • The total heat budget term (RHS) indicated a slightly warming tendency in Feb 2011, but the warming tendency was smaller than dT/dt. Huang, B., Y. Xue, X. Zhang, A. Kumar, and M. J. McPhaden, 2010 : The NCEP GODAS ocean analysis of the tropical Pacific mixed layer heat budget on seasonal to interannual time scales, J. Climate., 23, 4901-4925. Qu: Zonal advection; Qv: Meridional advection; Qw: Vertical entrainment; Qzz: Vertical diffusion Qq: (Qnet - Qpen + Qcorr)/ρcph; Qnet = SW + LW + LH +SH; Qpen: SW penetration; Qcorr: Flux correction due to relaxation to OI SST
Warm Water Volume (WWV) and NINO3.4 Anomalies Fig. P3. Phase diagram of Warm Water Volume (WWV) and NINO 3.4 SST anomalies. WWV is the average of depth of 20ºC in [120ºE-80ºW, 5ºS-5ºN] calculated with the NCEP's global ocean data assimilation system. Anomalies for WWV (NINO 3.4) are departures from the 1982-2004 (1981-2010) base period means. • WWV is defined as average of depth of 20ºC in [120ºE-80ºW, 5ºS-5ºN] (Meinen and McPhaden, 2000). • Since WWV is intimately linked to ENSO variability (Wyrtki 1985; Jin 1997), it is useful to monitor ENSO in a phase space of WWV and NINO3.4 (Kessler 2002). • Increase (decrease) of WWV indicates recharge (discharge) of the equatorial oceanic heat content. 2009/10 El Nino 2008/09 La Nina 2010/11 La Nina • Nino3.4 became less than -1oC since Jul 2010, indicating moderate-strong La Nina conditions. • Nino3.4 has persisted from Sep 2010 to Jan 2011 and weakened in Feb 2011. • WWV discharge weakened since Oct. 2010, and recharge enhanced significantly in Feb. 2011 due to the recent downwelling Kelvin wave episode and air-sea coupling. • Overall consisted with the weakening tendency of La Nina conditions.
Evolution of Equatorial Pacific SST (ºC), 0-300m Heat Content (ºC), 850-mb Zonal Wind (m/s), and OLR (W/m2) Anomaly Fig. P4. Time-longitude section of anomalous pentad sea surface temperature (left), upper 300m temperature average (heat content, middle-left), 850-mb zonal wind (U850, middle-right) averaged in 2OS-2ON and Outgoing Long-wave Radiation (OLR, right) averaged in 5OS-5ON. SST is derived from the NCEP OI SST, heat content from the NCEP's global ocean data assimilation system, U850 from the NCEP CDAS. Anomalies for SST, heat content and U850/OLR are departures from the 1981-2010, 1982-2004, 1979-1995 base period pentad means respectively. • Positive HC300A in the western tropical Pacific enhanced since Dec 2010, and negative HC300A in the eastern tropical Pacific weakened since mid-Jan 2011 in response to weakened anomalous easterly winds. • Suppressed convection in the equatorial central Pacific persisted since Dec 2010.
Evolution of Equatorial Pacific Surface Zonal Current Anomaly (cm/s) • Eastward anomalous current was presented in the central and eastern equatorial Pacific since late of Jan 2011, implying reduction of the zonal advection contribution to the cooling associated with the La Niña conditions. • Anomalous zonal current was consistent between the GODAS and OSCAR in last two months.
ENSO cycle as indicated by 1st EOF of surface current and SST anomalies • Westward surface zonal current anomaly has weakened rapidly since Jul 2010, and the zonal current anomaly became eastward since Dec 2010. • On average, ocean surface zonal current anomaly leads the SSTA by a few months. First EOF mode of ocean surface current (SC) and SST anomalies for the past decade extending through the latest 10-day period. The amplitude time series (top panel) are computed by fitting the data sets to 10-year base period eigenvectors (1993-2002). The amplitudes are then normalized by their respective standard deviations. The bottom panel shows the corresponding EOF maps, scaled accordingly. The El Niño signal can be seen as periods of positive excursions (> 1 Std. Dev.) of the amplitude time series. T the near real-time SC are the output from a diagnostic model. (supplied by Dr. Kathleen Dohan and see “http://www.esr.org/enso_index.html” for details)
Equatorial Pacific Temperature Anomaly TAO GODAS TAO climatology used • Negative temperature anomalies in the equatorial east and central Pacific weakened significantly in Feb 2011. • Positive temperature anomalies in the equatorial western Pacific enhanced and propagated eastward in Feb 2011. • Compared to TAO, GODAS has cold biases of about 2OC east of 110OW in the top 75m.
Oceanic Kelvin Wave Indices • Downwelling Kelvin wave observed in late Jan 2011 in the W. Pacific and propagated eastward, which may be a reason causing the weakening tendency of the La Nina event. • The speed of the eastward propagation is slower than free Kelvin wave, probably due to impact of air-sea coupling. • Extended EOF (EEOF) analysis is applied to 20-120 day filtered equatorial temperature anomaly in the top 300m using 14 lagged pentads (similar to that in Seo and Xue, GRL, 2005). • EEOF 1 describes eastward propagation of oceanic Kelvin wave cross the equatorial Pacific in about 70 days. • Oceanic Kelvin wave indices are defined as standardized projections of total anomalies onto the 14 patterns of EEOF 1.
Tropical Pacific: SST Anom., SST Anom. Tend., OLR, Sfc Rad, Sfc Flx, 925-mb & 200-mb Winds • Negative SSTA weakened in the east-central equatorial Pacific in Feb 2011. • Convection was active (inactive) over the Maritime Continent (west-central tropical Pacific). • Net surface heat flux anomalies damped SSTA between 150oW-90oW. • Easterly (westerly) wind anomaly in low (high) level in the western and central tropical Pacific persisted in Feb 2011. C C Fig. P2. Sea surface temperature (SST) anomalies (top-left), anomaly tendency (top-right), Outgoing Long-wave Radiation (OLR) anomalies (middle-left), sum of net surface short- and long-wave radiation, latent and sensible heat flux anomalies (middle-right), 925-mb wind anomaly vector and its amplitude (bottom-left), 200-mb wind anomaly vector and its amplitude (bottom-right). SST are derived from the NCEP OI SST analysis, OLR from the NOAA 18 AVHRR IR window channel measurements by NESDIS, winds and surface radiation and heat fluxes from the NCEP CDAS. Anomalies are departures from the 1979-1995 base period means except SST anomalies are computed with respect to the 1981-2010 base period means.
North Pacific & Arctic Ocean: SST Anom., SST Anom. Tend., OLR, SLP, Sfc Rad, Sfc Flx • Positive (small negative) SSTA was observed in the central N. Pacific (in the eastern and southwest N. Pacific) in Feb 2011, consistent with the slightly weakening of the negative PDO index (next slide). • SSTA tendency was small and generally consists with total heat flux anomalies (LH+SH+SW+LW). • Positive (negative) SLP anomaly presented in the central N. Pacific (near north pole). Fig. NP1. Sea surface temperature (SST) anomalies (top-left), anomaly tendency (top-right), Outgoing Long-wave Radiation (OLR) anomalies (middle-left), sea surface pressure anomalies (middle-right), sum of net surface short- and long-wave radiation anomalies (bottom-left), sum of latent and sensible heat flux anomalies (bottom-right). SST are derived from the NCEP OI SST analysis, OLR from the NOAA 18 AVHRR IR window channel measurements by NESDIS, sea surface pressure and surface radiation and heat fluxes from the NCEP CDAS. Anomalies are departures from the 1979-1995 base period means except SST anomalies are computed with respect to the 1981-2010 base period means.
PDO index • The PDO index was -1.3 in Feb 2011. • The negative PDO index slightly weakened since Jan 2011. • The PDO index has been below normal since Jun 2010, which was coincident with the La Nina conditions. • Pacific Decadal Oscillation is defined as the 1st EOF of monthly ERSST v3b in the North Pacific for the period 1900-1993. PDO index is the standardized projection of the monthly SST anomalies onto the 1st EOF pattern. • The PDO index differs slightly from that of JISAO, which uses a blend of UKMET and OIv1 and OIv2 SST.
Arctic Sea Ice National Snow and Ice Data Center http://nsidc.org/arcticseaicenews/index.html • The Arctic sea ice extent was well blow normal and became smaller than the 2006-2007 value since mid-Dec 2010 • The sea ice deficit was observed in the subpolar region of both N. Atlantic and N. Pacific.
NorthAmerica Western Coastal Upwelling Fig. NP2. Total (top) and anomalous (bottom) upwelling indices at the 15 standard locations for the western coast of North America. Upwelling indices are derived from the vertical velocity of the NCEP's global ocean data assimilation system, and are calculated as integrated vertical volume transport at 50 meter depth from each location to its nearest coast point (m3/s/100m coastline). Anomalies are departures from the 1982-2004 base period pentad means. • Seasonal downwelling weakened substantially and became upwelling north of 33oN since Mid-Feb 2011. • Area below (above) black line indicates climatological upwelling (downwelling) season. • Climatologically upwelling season progresses from March to July along the west coast of North America from 36ºN to 57ºN.
Monthly Chlorophyll Anomaly • Positive chlorophyll anomalies dominated at 20oN-50oN in last two months, consistent with strengthened anomalous upwelling. http://coastwatch.pfel.noaa.gov/FAST
NorthAmerica Western Coastal Upwelling Fig. NP2. Total (top) and anomalous (bottom) upwelling indices at the 15 standard locations for the western coast of North America. Upwelling indices are derived from the vertical velocity of the NCEP's global ocean data assimilation system, and are calculated as integrated vertical volume transport at 50 meter depth from each location to its nearest coast point (m3/s/100m coastline). Anomalies are departures from the 1982-2004 base period pentad means. • Seasonal downwelling was weaker than climatology during the winter of 2006/07, 2007/08, 2008/09, and 2010/11. • But, seasonal downwelling was stronger than climatology during the winter of 2009/10. • Area below (above) black line indicates climatological upwelling (downwelling) season. • Climatologically upwelling season progresses from March to July along the west coast of North America from 36ºN to 57ºN.
Evolution of Indian Ocean SST Indices • Both eastern (SETIO) and western (WTIO) pole SSTA was negative since Jan 2011, consistent with basin wide negative SSTA. • DMI has been below-normal since May 2010, strengthened during Sep-Oct 2010, and returned to near-normal since Jan 2011. • Compared with Feb 2010, a basin wide cooling of about 2oC was observed in Feb. 2011, which is consistent with the contrast impacts of the 2009/10 El Nino and the 2010/2011 La Nina. Fig. I1a. Indian Ocean Dipole region indices, calculated as the area-averaged monthly mean sea surface temperature anomalies (OC) for the SETIO [90ºE-110ºE, 10ºS-0] and WTIO [50ºE-70ºE, 10ºS-10ºN] regions, and Dipole Mode Index, defined as differences between WTIO and SETIO. Data are derived from the NCEP OI SST analysis, and anomalies are departures from the 1981-2010 base period means.
Recent Evolution of Equatorial Indian SST (ºC), 0-300m Heat Content (ºC), 850-mb Zonal Wind (m/s) and OLR (W/m2) Anomalies Fig. I3. Time-longitude section of anomalous pentad sea surface temperature (left), upper 300m temperature average (heat content, middle-left), 850-mb zonal wind (U850, middle-right) averaged in 2OS-2ON and Outgoing Long-wave Radiation (OLR, right) averaged in 5OS-5ON. SST are derived from the NCEP OI SST, heat content from the NCEP's global ocean data assimilation system, and U850 from the NCEP CDAS. Anomalies for SST, heat content and U850/OLR are departures from the 1981-2010, 1982-2004, 1979-1995 base period pentad means respectively. • SSTA switched to negative for the whole basin since mid-Dec 2010, probably due to the delayed impact of the La Nina. • Positive (negative) heat content anomaly presented in the eastern (western) Indian Ocean in response to anomalous westerly wind forcing in the central tropical Indian Ocean.
Connection of Pacific and Indian Oceans:Central and eastern Pacific SSTA seems to lead Indian Ocean SST by a few months Indian Ocean: 2S-2N Pacific Ocean: 2S-2N
Recent Evolution of 10ºS Indian SST (ºC), 0-300m Heat Content (ºC), 850-mb Zonal Wind (m/s) Fig. I4. Time-longitude section of anomalous pentad sea surface temperature (left), upper 300m temperature average (heat content, middle-left), 850-mb zonal wind (U850, middle-right) averaged in 12OS-8OS and Outgoing Long-wave Radiation (OLR, right) averaged in 5OS-5ON. SST are derived from the NCEP OI SST, heat content from the NCEP's global ocean data assimilation system, and U850 from the NCEP CDAS. Anomalies for SST, heat content and U850/OLR are departures from the 1981-2010, 1982-2004, 1979-1995 base period pentad means respectively. • SSTA switched to negative since Jan 2011 in the southen Indian Ocean. • Westerly wind anomalies strengthened in the southeastern tropical Indian Ocean, which are probably part of enhanced atmospheric circulations associated with the La Nina conditions. • The dipole HC300A, negative near 80oE and positive near 110oE, enhanced and propagated westward.
Tropical Indian: SST Anom., SST Anom. Tend., OLR, Sfc Rad, Sfc Flx, 925-mb & 200-mb Wind Anom. • Negative SSTA dominated the whole basin. • SSTA tendency was small and generally consisted the net surface heat flux anomalies. • Convection was enhanced (suppressed) in the eastern and southwestern (central) tropical Indian Ocean. Fig. I2. Sea surface temperature (SST) anomalies (top-left), anomaly tendency (top-right), Outgoing Long-wave Radiation (OLR) anomalies (middle-left), sum of net surface short- and long-wave radiation, latent and sensible heat flux anomalies (middle-right), 925-mb wind anomaly vector and its amplitude (bottom-left), 200-mb wind anomaly vector and its amplitude (bottom-right). SST are derived from the NCEP OI SST analysis, OLR from the NOAA 18 AVHRR IR window channel measurements by NESDIS, winds and surface radiation and heat fluxes from the NCEP CDAS. Anomalies are departures from the 1979-1995 base period means except SST anomalies are computed with respect to the 1981-2010 base period means.
Evolution of Tropical Atlantic SST Indices Fig. A1a. Tropical Atlantic Variability region indices, calculated as the area-averaged monthly mean sea surface temperature anomalies (ºC) for the TNA [60ºW-30ºW, 5ºN-20ºN], TSA [30ºW-10ºE, 20ºS-0] and ATL3 [20ºW-0, 2.5ºS-2.5ºN] regions, and Meridional Gradient Index, defined as differences between TNA and TSA. Data are derived from the NCEP OI SST analysis, and anomalies are departures from the 1981-2010 base period means. • Positive SSTA decreased for TNA and increased for TSA since Dec 2010. - Meridional Gradient Mode (TNA-TSA) has been above-normal since Feb 2010, near normal in Feb 2011. • Positive ATL3 SST persistent since Jan 2010.
Tropical Atlantic: • Positive SSTA in the tropical N. Atlantic weakened slightly. • Convection was enhanced over the northern S. America, the eastern tropical Pacific, consistent with the La Nina conditions. • SSTA tendency was generally consistent with total heat flux, particularly LH+SH.
North Atlantic: SST Anom., SST Anom. Tend., OLR, SLP, Sfc Rad, Sfc Flx • NAO switched to positive phase in Feb 2011 (next slide), consistent with the SLP anomaly pattern. • SSTA tendency was largely consistent with surface heat flux anomalies (SW+LW+LH+SH). Fig. NA1. Sea surface temperature (SST) anomalies (top-left), anomaly tendency (top-right), Outgoing Long-wave Radiation (OLR) anomalies (middle-left), sea surface pressure anomalies (middle-right), sum of net surface short- and long-wave radiation anomalies (bottom-left), sum of latent and sensible heat flux anomalies (bottom-right). SST are derived from the NCEP OI SST analysis, OLR from the NOAA 18 AVHRR IR window channel measurements by NESDIS, sea surface pressure and surface radiation and heat fluxes from the NCEP CDAS. Anomalies are departures from the 1979-1995 base period means except SST anomalies are computed with respect to the 1981-2010 base period means.
NAO and SST Anomaly in North Atlantic Fig. NA2. Monthly standardized NAO index (top) derived from monthly standardized 500-mb height anomalies obtained from the NCEP CDAS in 20ºN-90ºN (http://www.cpc.ncep.noaa.gov). Time-Latitude section of SST anomalies averaged between 80ºW and 20ºW (bottom). SST are derived from the NCEP OI SST analysis, and anomalies are departures from the 1981-2010 base period means. • NAO switched from negative to positive phase in Feb 2011 with NAO Index=0.70. • Negative SSTA still appeared in mid-latitude, and warming in the low and high latitudes of North Atlantic. • Overall amplitudes of the SSTA associated with tripole pattern weakened in Feb 2011, consistent with the phase switching of the NAO.
NAO and SST Anomaly in North Atlantic Fig. NA2. Monthly standardized NAO index (top) derived from monthly standardized 500-mb height anomalies obtained from the NCEP CDAS in 20ºN-90ºN (http://www.cpc.ncep.noaa.gov). Time-Latitude section of SST anomalies averaged between 80ºW and 20ºW (bottom). SST are derived from the NCEP OI SST analysis, and anomalies are departures from the 1981-2010 base period means. • NAO was persistently below-normal during Oct 2009-Jan 2011, which contributed to the development and maintenance of negative (positive) SSTA in mid-latitude (tropical and high latitude) North Atlantic. • The tripole or horseshoe pattern of SSTA in 2009-2011 was largely associated with the influence of NAO and ENSO cycle, as well as long-term trend and SST feedback.
CFS Niño3.4 SST Predictions from Different Initial Months Fig. M1. CFS Nino3.4 SST prediction from the latest 9 initial months. Displayed are 40 forecast members (brown) made four times per day initialized from the last 10 days of the initial month (labelled as IC=MonthYear) as well as ensemble mean (blue) and observations (black). The hindcast climatology for 1981-2006 was removed, and replaced by corresponding observation climatology for the same period. Anomalies were computed with respect to the 1981-2010 base period means. • Forecasts from Jun-Dec I.C. had cold biases. The recent cold forecast biases can be alleviated through statistical model corrections (http://www.cpc.ncep.noaa.gov/products/people/wwang/cfs_fcst). • The latest forecasts from Feb 2011 I.C. suggest that the current La Niña was in decay phase since Jan 2011, and ENSO will be near neutral in the summer 2011.
U. S. Seasonal Outlooks: Mar-Apr-May 2011 ) (Made 17 Feb 2011 Temperature Precipitation The seasonal outlooks combine the effects of long-term trends, soil moisture, and, when appropriate, the ENSO cycle. http://www.cpc.ncep.noaa.gov/products/predictions/long_range/two_class.php
CFS DMI SST Predictions from Different Initial Months DMI = WTIO- SETIO SETIO = SST anomaly in [90oE-110oE, 10oS-0] WTIO = SST anomaly in [50oE-70oE, 10oS-10oN] Fig. M2. CFS Dipole Model Index (DMI) SST predictions from the latest 9 initial months. Displayed are 40 forecast members (brown) made four times per day initialized from the last 10 days of the initial month (labelled as IC=MonthYear) as well as ensemble mean (blue) and observations (black). The hindcast climatology for 1981-2006 was removed, and replaced by corresponding observation climatology for the same period. Anomalies were computed with respect to the 1981-2010 base period means. • - The spread between individual members was large, implying the uncertainty of the forecasts. • Forecasts from Feb 2011 I.C. suggest a near neutral IOD will develop in summer 2011.
CFS Tropical North Atlantic (TNA) SST Predictions from Different Initial Months TNA is the SST anomaly averaged in the region of [60oW-30oW, 5oN-20oN]. Fig. M3. CFS Tropical North Atlantic (TNA) SST predictions from the latest 9 initial months. Displayed are 40 forecast members (brown) made four times per day initialized from the last 10 days of the initial month (labelled as IC=MonthYear) as well as ensemble mean (blue) and observations (black). The hindcast climatology for 1981-2006 was removed, and replaced by corresponding observation climatology for the same period. Anomalies were computed with respect to the 1981-2010 base period means. • Cold forecast biases were evident, may due to the fact that the NAO and its impact were poorly predicted. - Latest forecasts suggest that positive SSTA in the tropical North Atlantic will decay slowly in next few months, and become near-normal in summer/autumn 2011.
CFS Pacific Decadal Oscillation (PDO) Index Predictions from Different Initial Months PDO is the first EOF of monthly ERSSTv3b anomaly in the region of [110oE-100oW, 20oN-60oN]. CFS PDO index is the standardized projection of CFS SST forecast anomalies onto the PDO EOF pattern. • The onset of the negative phase of the PDO was poorly forecast. • Latest forecasts suggest that the negative phase of the PDO will weaken in next few months and will last into the summer 2011. Fig. M4. CFS Pacific Decadal Oscillation (PDO) index predictions from the latest 9 initial months. Displayed are 40 forecast members (brown) made four times per day initialized from the last 10 days of the initial month (labelled as IC=MonthYear) as well as ensemble mean (blue) and observations (black). The hindcast climatology for 1981-2006 was removed, and replaced by corresponding observation climatology for the same period. Anomalies were computed with respect to the 1981-2010 base period means.
Overview • Pacific and Arctic Oceans • ENSO cycle: La Niña conditions weakened with NINO3.4=-1.2oC in Feb 2011. • NOAA/NCEP Climate Forecast System (CFS) suggests that the current La Niña is in a decay phase, and ENSO will be near neutral in the summer 2011. • PDO has been negative since Jun 2010, and weakened slightly since Jan 2011 with PDO index=-1.3 in Feb 2011. • Anomalous upwelling strengthened at 36ON-57ON along the west coast of North America in Feb 2011, leading to above-normal nutrient supply. • Artic sea ice extent was well below normal, and smaller than that of 2006-2007 since mid-Dec 2010. • Indian Ocean • SSTA was small negative. • Atlantic Ocean • After 16 month persistent negative phase (Oct 2009-Jan2011), NAO switched to positive phase with NAO index = 0.70 in Feb 2011. • Tripole SSTA pattern weakened in Feb 2011.
Data Sources and References Please send your comments and suggestions to Yan.Xue@noaa.gov. Thanks! • Optimal Interpolation SST (OI SST) version 2 (Reynolds et al. 2002) • SST 1971-2000 base period means (Xue et al. 2003) • NCEP CDAS winds, surface radiation and heat fluxes • NESDIS Outgoing Long-wave Radiation • NDBC TAO data (http://tao.noaa.gov) • PMEL TAO equatorial temperature analysis • NCEP’s Global Ocean Data Assimilation System temperature, heat content, currents (Behringer and Xue 2004) • Aviso Altimetry Sea Surface Height • Ocean Surface Current Analyses – Realtime (OSCAR)