Download
1 / 35

E N D
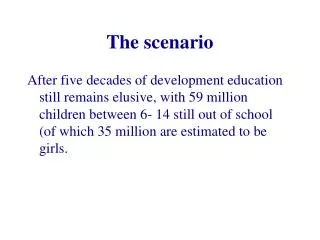
The Scenario Susan interviewed the twenty five students in her class, asking each person how often they eat out. Most students replied between zero and three times. However, one student reported eating out for every single meal (21 meals a week). Data: 2, 0, 1, 0, 2, 2, 1, 0, 0, 2, 1, 3, 3, 3, 2, 1, 3, 21, 1, 1, 0, 3, 1, 2, 2Which measure of central tendency will best convey how often the students typically eat out? Possible Answers: Mean, Median, or Mode
Mean Mean: The arithmetic average. Add up all of the values and divide by the number of scores. Mean = 2, 0, 1, 0, 2, 2, 1, 0, 0, 2, 1, 3, 3, 3, 2, 1, 3, 21, 1, 1, 0, 3, 1, 2, 2 25 = 57 meals ‘eaten out’ 25 students = 2.28 meals ‘eaten out’ per student
Mean Consider what the mean would be without the outlier… Mean = 2, 0, 1, 0, 2, 2, 1, 0, 0, 2, 1, 3, 3, 3, 2, 1, 3, 1, 1, 0, 3, 1, 2, 2 24 = 36 meals eat out 24 students = 1.5 meals ‘eat out’ per student
Mean College Student Income US Dollars(in thousands)
Mean College Student Income US Dollars(in thousands)
Mean College Student Income US Dollars(in millions)
Mean Based on the Mean… College Students are Millionaires! Mean US Dollars(in millions)
Mean Mean – Uses all data, but is sensitive to outliers
Mode • Mode: The most frequently occurring value
Mode • Mode: The most frequently occurring value • Modes: 1, 2
Mode • Mode: The most frequently occurring value • Mode: 0 A small change in frequency can affect the mode(s)
Mode • Mode: The most frequently occurring value • Mode: 0 Students Don’t Typically Eat Out A small change in frequency can affect the mode(s)
Mode Mode – Perhaps the least robust. Easily affected by small changes in frequency
Median Median: The middle value in a ranked distribution. If there are an even number of values, then take the average of the middle two values.
Median Median: The middle value in a ranked distribution. If there is an even number of values, then take the average of the middle two values. Raw Data: 2, 0, 1, 0, 2, 2, 1, 0, 0, 2, 1, 3, 3, 3, 2, 1, 3, 21, 1, 1, 0, 3, 1, 2, 2
Median Median: The middle value in a ranked distribution. If there is an even number of values, then take the average of the middle two values. Raw Data: 2, 0, 1, 0, 2, 2, 1, 0, 0, 2, 1, 3, 3, 3, 2, 1, 3, 21, 1, 1, 0, 3, 1, 2, 2 Ranked: 0, 0, 0, 0, 0, 1, 1, 1, 1, 1, 1, 1, 2, 2, 2, 2, 2, 2, 2, 3, 3, 3, 3, 3, 21
Median Median: The middle value in a ranked distribution. If there is an even number of values, then take the average of the middle two values. Raw Data: 2, 0, 1, 0, 2, 2, 1, 0, 0, 2, 1, 3, 3, 3, 2, 1, 3, 21, 1, 1, 0, 3, 1, 2, 2 Ranked: 0, 0, 0, 0, 0, 1, 1, 1, 1, 1, 1, 1, 2, 2, 2, 2, 2, 2, 2, 3, 3, 3, 3, 3, 21
Median Median: The middle value in a ranked distribution. If there is an even number of values, then take the average of the middle two values. Raw Data: 2, 0, 1, 0, 2, 2, 1, 0, 0, 2, 1, 3, 3, 3, 2, 1, 3, 21, 1, 1, 0, 3, 1, 2, 2 Ranked: 0, 0, 0, 0, 0, 1, 1, 1, 1, 1, 1, 1, 2, 2, 2, 2, 2, 2, 2, 3, 3, 3, 3, 3, 21 Median: 2
Mean Based on the Mean… College Students are Millionaires! Mean US Dollars(in millions)
Median Based on the Median… College Students as a Group Aren’t Wealthy Median US Dollars(in millions)
Median Based on the Median… College Students as a Group Aren’t Wealthy Median US Dollars(in millions)
Median Median – Does not use all data, but is robust; not affected by outliers
Measures of Central Tendency – And Outliers When there is an outlier, which measure of central tendency can we generally count on to give us the best measure of what is typical? • Which measure should Susan report?
Measures of Central Tendency – And Outliers When there is an outlier, which measure of central tendency can we generally count on to give us the best measure of what is typical? • Which measure should Susan report? Mean – Uses all data, but sensitive to outliers
Measures of Central Tendency – And Outliers When there is an outlier, which measure of central tendency can we generally count on to give us the best measure of what is typical? • Which measure should Susan report? Mean – Uses all data, but sensitive to outliersMode – Easily affected by small changes in frequency
Measures of Central Tendency – And Outliers When there is an outlier, which measure of central tendency can we generally count on to give us the best measure of what is typical? • Which measure should Susan report? Mean – Uses all data, but sensitive to outliersMode – Easily affected by small changes in frequency Median – Does not use all data, but is robust
Measures of Central Tendency – And Outliers Real World Use When there is an outlier, your reporting options are to report: Median, or Median and Mean
Measures of Central Tendency – And Outliers Real World Use When there is an outlier, your reporting options are to report: Median, or Median and Mean If you think the outlier does not belong in the data set (i.e., was an error)… then consider also reporting the mean without the outlier.
References Posted onFlickr as fast food is the best! by Ebruli. Available under Creative Commons Attribution 2.0 Generic License to share and remix. Posted on Wikimedia Commons as Earth Western Hemisphere white background by Hansjorn. Available in the Public Domain.
References Posted onFlickr as Money! by Tracy O. Available under Creative Commons Attribution-Share Alike 2.0 Generic License to share and remix. Posted on Wikimedia Commons as Bill Gates 2004 crop. Originally posted to Flickr by deVos. Available under Creative Commons Attribution-Share Alike 2.0 Generic License to share and remix.
Appendix: Online Resources Mean, Median, and Mode Song From LearningUpGrade.com; posted on YouTube. Description of Video: A basic overview of how to determine the mean, median and mode. Includes music and animation. Length: 1m 33s. View at tinyurl.com/yfsnmh9 • Comparing the Properties of the Mean and the Median • at Principles & Standards for School Mathematics • Description of this Interactive Demonstration: Move the numbers around on the number line, and see the corresponding effect on the mean and median. How do outliers affect the mean and median?Length: Interactive Demonstration • Participate at tinyurl.com/33tngr
Appendix: Online Resources Statistics: The Average Posted by khanacademy on YouTube. Description of Video: A more in depth, college level, introduction to the mean, median, and mode. Note – starts with a blank screen, which is then written upon…Length: 12m 35s View at tinyurl.com/ykbbvmj • It’s Not Hard (Averages Song) • Posted on YouTube by jalapenojane. • Description of Video: This is just for fun…. Covers mean, median, and mode in a way that may leave you laughing aloud.Length: 3m 49s • View at tinyurl.com/yhc885w
Appendix: Creative Commons License Creative Commons Attribution-Share Alike 3.0 License You are free to share (copy, distribution and transmit the work) and to remix (to adapt the work) this Powerpoint Presentation What to Report When There is an Outlier by Robert G. Kelley, Ph.D. on the condition that you provide attribution (you must attribute the work in a manner specified by the author or licensor – but not in any way that suggests that they endorse you use of the work) and share alike (if you alter, transform, or build upon this work, you may distribute the resulting work only under the same, similar or compatible license) this work. Note that the online resources listed in the appendix are separate works from this Powerpoint presentation, and are not covered by this Creative Commons License. Please attribute this work to: Robert G. Kelley, Ph.D. (www.miracosta.edu/home/rkelley)