Download
1 / 1
10 likes | 86 Views
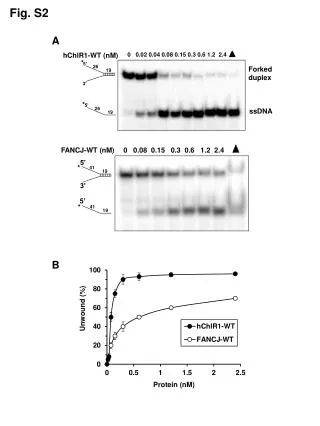
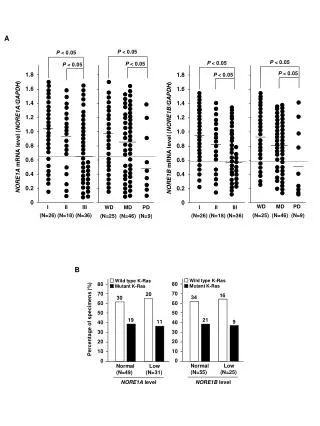
This study investigates NORE1A and NORE1B mRNA levels in cancer subtypes I, II, and III, analyzing the correlation with wild-type and mutant K-Ras. A total of 80 specimens were used to compare the expression levels in different cancer stages.

E N D
P < 0.05 P < 0.05 P < 0.05 P < 0.05 P < 0.05 P < 0.05 P < 0.05 P < 0.05 1.8 1.6 1.4 1.2 1.0 0.8 0.6 0.4 0.2 0 1.8 1.6 1.4 1.2 1.0 0.8 0.6 0.4 0.2 0 NORE1A mRNA level (NORE1A/GAPDH) NORE1B mRNA level (NORE1B/GAPDH) WD MD PD (N=25) (N=46) (N=9) I II III (N=26) (N=18) (N=36) WD MD PD (N=25) (N=46) (N=9) I II III (N=26) (N=18) (N=36) Wild type K-Ras Mutant K-Ras Wild type K-Ras Mutant K-Ras 80 70 60 50 40 30 20 10 0 80 70 60 50 40 30 20 10 0 20 16 34 30 Percentage of specimens (%) 19 21 11 9 Normal Low (N=55) (N=25) Normal Low (N=49) (N=31) NORE1B level NORE1A level A B