Understanding Statistical Hypothesis Testing: A Guide to Scientific Experimentation
400 likes | 538 Views
This guide explores the fundamentals of statistical hypothesis testing and scientific experimentation. It highlights how scientific theories make predictions that can be tested and revised based on observed outcomes. The concept of null hypotheses, probability, and the significance of observing unlikely events are discussed. The guide emphasizes that no outcome is impossible, and introduces the standard practice of rejecting hypotheses when data fall within a predefined rejection region. It aims to provide a clearer understanding of how statistics function within scientific frameworks.

Understanding Statistical Hypothesis Testing: A Guide to Scientific Experimentation
E N D
Presentation Transcript
Yea, we finally get to do Statistics! Kert Viele Department of Statistics University of Kentucky
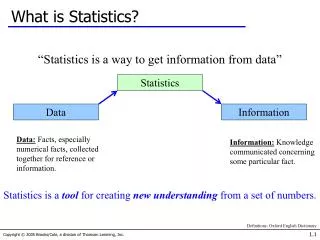
Scientific Experimentation • Scientific theories make predictions. • In a scientific experiment to test a theory, a new situation is created where the theory makes a specific prediction. We try to observe if that prediction comes true. • If the prediction does come true, it is evidence in favor of the theory (typically not proof). If the prediction does not occur, the theory must be revised, or perhaps complete discarded.
A simple theory • A very simple theory is that “All ravens are black”. • This theory only makes predictions about ravens, so the natural thing to do to test this theory is to observe ravens. • If you observe black ravens, this confirms the theory (doesn’t proof it though, we’d have to observe all ravens to do that) • If you observe a white raven, the theory is proven wrong.
Statistical Theories • Statistical hypotheses are hypotheses that discuss probabilities. Saying “this coin is fair” means that in the long run 50% of the flips will be heads. • Many theories can be placed in this framework. • The hypothesis “all ravens are black”, in statistical terms, is that the probability a raven is black is 100%, and thus the probability a raven is not black is 0%.
If the impossible happens…discard the theory • In statistical terms, what happens when we observe a non-black raven? • We can go “hmm, what were the odds of that? If the hypothesis were true, that would NEVER happen” • Therefore, the hypothesis is NOT true.
With statistics, nothing is impossible! • Fundamental idea – if the hypothesis says an event is impossible but it happens anyway, the hypothesis is wrong • Unfortunately, with most statistical hypothesis, nothing is impossible. • Let’s go back to the hypothesis that a particular coin is fair.
What about unlikely events? • Suppose we flip the coin 100 times and observe 98 heads and 2 tails. Most people would be more than a little suspicious of whether the coin is fair. • The reasonable source of this suspicion is that observing 98 head and 2 tails is quite unlikely. • However, it is NOT impossible.
Back to the drawing board • In fact, no outcome is impossible. You can get anywhere from 0 to 100 heads in 100 flips. • If our standard was only to disprove a hypothesis when something impossible (according to the hypothesis) occurred, then we would never make any progress with the hypothesis “this coin is fair”. We’d always be in limbo.
The “unlikely” standard • Since the “impossibility” standard is unavailable for most statistical hypothesis, we use a weaker standard (the best we have). • Impossible = with probability 0 • Unlikely = with a small probability (more than 0, but small). For historical reasons, unlikely = 5% typically. • We work with “if something unlikely occurs, then the hypothesis is likely wrong”, called “rejecting the hypothesis”.
Summary until now…still awake? • The statistical idea of hypothesis tests is based on the idea of concluding an hypothesis is likely wrong when an unlikely event occurs. • This is of course weaker than completely disproving a hypothesis when an impossible event occurs, but hey, it’s what we got.
Implementing the “unlikely” standard • The standard procedure in a statistical hypothesis test is to “reject” the hypothesis when the data fall in a rejection region. • The rejection region is set so that, if the hypothesis is true, the rejection region has a 5% (unlikely) chance of occurring. • In most standard situations, the hypothesis translates (use probability theory) to an approximate normal distribution for the data.
Reject in the tails • Generally, you reject the hypothesis if the observed data is too far away from the hypothesized value (i.e. too far into the tails). • For normal distributions, you get your usual “reject if the data is 1.96 standard deviations from the predicted mean”. The 1.96 is often just truncated to 2 for “eyeballing” purposes.
You got a problem with that? • You may disagree with 5% as a reasonable definition of “unlikely”. You may use something else, but keep in mind that this is just “the way it is” with respect to many journal publications, etc. • The probability has all been worked out in many common situations. • Most standard statistical packages allow you to enter data (from EXCEL or another package) and just click a few buttons to get an answer. Just remember, know what the buttons means when you click them!
Normal distributions • In most common situation, the hypothesis you are testing implies the data will have a normal (bell-shaped distribution). • Normal distributions have two parameters, a mean μ (mu, unless you are from England where it is “moo”) and a variance σ (sigma) • μ determines the center of the distribution, while σ determines the spread.
Small σ’s are good. • In scientific context, μ is fixed by the process we are studying (the coin has some probability of landing head, our animals have a certain level of activity). We unfortunately don’t know what μ is, and we can’t control it. • σ, on the other hand, is much more controllable. Anything that eliminates noise in our data decreases σ.
Why are small σ’s good? • Consider two competing scientific theories, one which states μ=μ0 and another which states μ≠μ0. • Under the null hypothesis μ=μ0, we expect a normal distribution to appear, centered at μ0 • The value of σ depends on the inherent noise in the problem AND our experimental design choices. • For the example that follows, μ0 = 10.
Our hypothesis testing procedure Reject in the red area, do not reject in the green area
We can make mistakes… • Recall we “reject” the hypothesis if our observed data is too far from the hypothesis (i.e. out in the tails of the null distribution). • This is what we called the rejection region • However, nothing is impossible in most statistical hypotheses, there is a chance we can make a mistake.
Type I error • We fixed the rejection region so that, when the null hypothesis is true, we have a 5% chance of incorrect rejecting the hypothesis. • This is called the type I error, or “size” of the test. • This of course also means that, when the null hypothesis is true, we have a 95% chance of making the correct decision.
What if the hypothesis is false? • If our hypothesis is not true, then the real value of μ is something other than μ0, and our data comes from a different distribution. • We keep the same rejection region. • What does this look like?
With μ=14, but with the same rejection region. There’s more red.
Type II error • Again, when the null distribution is the right one, we have a 5% chance of making a mistake and a 95% of not making a mistake. • When the alternative hypothesis is true, we have different probabilities. For the graph shown here, the probability of rejecting is 26.6%. • But wait, when the alternative hypothesis is true, rejecting is a good thing.
Type II error, continued • When the alternative hypothesis is true, we want to reject the null hypothesis. The probability of doing this is called the “power” of the test. • When the alternative hypothesis is true, the act of not rejecting is called type II error. • A good test has low probabilities of both type I and type II error.
Decreasing σ results in a better chance of finding the truth. • Suppose we were able to decrease σ, making the normal distributions “thinner”. • This changes the rejection region, because we still fix the probability of type I error at 5%. • Basically, this results in making the “acceptance region”, the green area, smaller. • The increased accuracy lets us “hit a smaller target”, so to speak.
Under the alternative distribution, the data appears in the red more often.
The effect of decreasing σ • When the larger σ is used, the power was 26.6%. • When the smaller σ is used, the power increases to 98.0%. Thus the probability of type II error is only 2%. • Decreasing σ is a VERY good thing.
How do you decrease σ? • Thus, we focus a lot of effort on decreasing σ, which gives us better power and a better chance of making a strong scientific conclusion. • So how to we decrease σ? Remove noise from the experiment. There are several ways to do this.
Larger sample sizes are better, but more expensive in many ways. • Increase sample size! The larger the sample size, the thinner the normal distributions are. Of course, this goal of thinner normals competes with other demands on our time, our budget, and possible ethical concerns (you don’t want to expose people to a potentially dangerous drug any more than you have to, for example) • Never run an experiment with too small a sample size, though, you’ll get NOTHING out of it!
Blocking on known sources of noise. • If we know a specific variable will affect our responses, we will often try to control for that variable. • A quick example – if you are teaching, students who did well on last year’s standardized tests will tend to do well on this year’s standardized tests, and there is only so much that will change that.
Example • You are interesting in investigating the relative effectiveness of two different types of strength training (method A and method B) • Your response variable is the amount of weight that can be lifted at the end of the training. • You also know the amount each subject can currently lift.
Example continued • Presumably people who are stronger now will be stronger later. The issue is by how much. • One option is to fit an ANCOVA using the current weight as a continuous covariate. If you are concerned about linearity, then a randomized block design is sensible as well.
Conducting the experiment • To block on the current weight, take all the subjects and rank them by the current weight they can lift. • Divide the sorted list into block on 2 people each (2 = number of methods of strength training) • Within each block, assign one person to method A and one person to method B, at random. • This makes it FAR less likely method A or method B will have too much of an abundance of “strong people” in their groups than just random assignment of all subjects to groups A and B.
Moral of the randomization • Block for what you know makes a difference. • The randomization will likely equalize the groups on what you DON’T know makes a difference. • It’s possible there aren’t any other factors, and the randomization doesn’t matter, but it’s easy and it potentially helps. Finding out about another variable later is a bad scene.
Repeated measures • Animals vary amongst themselves, either through genetic or environmental factors. • Where possible, we would like to control this variation. We do this by applying each treatment to each animal. This is “blocking on animal”. • Blocking on animal is often not possible, for example the animal may be changed by the treatment. • When you block on animal randomize the order of the treatment so no treatment gets consistently placed first or last in the treatment order.
Control groups • Whenever making comparisons between treatments, you must have a group of animals for each potential treatment, including the “current”, or “default” treatment. • Without such a group, any difference you observe could be due to the fact the animals were involved in an experiment.