Download
1 / 20
200 likes | 334 Views
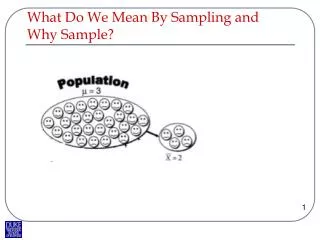
What Do We Mean By Sampling and Why Sample?. Sampling. Obtain measures from some subset of a population – from surveys, selections from a databases, …

E N D
Sampling • Obtain measures from some subset of a population – from surveys, selections from a databases, … • Properties of the samples and their quality depends on how the samples were taken, their size, response rates, representativeness, and other factors.
Sampling Designs • Probability • Allows for the use of statistical methods to make inference • Non-Probability • Generally involves personal judgment in the selection process • Might yield good estimates but, sampling error cannot be assessed. Cannot evaluate how precise an estimate is.
Probability Samples • Each element in population has known, nonzero chance of being sampled • Simple random sample: all elements have 1/n chance of being sampled • Stratified sampling: divide frame into “strata” according to a characteristic (e.g., gender), then sample randomly from each strata
Stratified Random Sampling • Can be cost efficient by increasing the precision of an estimate. Can also insure representation of smaller sub-groups. • Sort elements on some stratification variable believed to influence the variable you are estimating • Lower variance within each subgroup than across population in general • By ensuring that each subgroup is represented in right mix, extreme overall means are less likely, smaller standard errors are achieved, and cost of sampling is reduced • Can be proportionate or disproportionate
Stratification – Exaggerated Example SPSS Box Plots Not Stratified – one sample from entire distribution Stratified – two samples based on “x1”
Steps for Stratified Random Sampling • Divide population into mutually exclusive and exhaustive categories • Each member in one and only one strata • Decide what sampling frame to use • Draw an independent simple random sample from each group • Compute mean for each group • Estimate overall population mean as weighted average of group means
Sampling Sampling variation, which leads to a sampling distribution
Precision in Probability Samples • Distribution of original scores • Mean = • Proportion (mean of a variable coded 1 or 0) • Variance – Measure of the Average squared deviation from mean in the sample • Standard Deviation -- Square root of variance
Precision in Probability Samples • Standard Error of Sample Means – If we take a number of means we get a distribution for the means for samples of size n: SD of Sample Means* = SE pop mean = SD of pop. est. sqrt(n)
Milan Foods: Example of SE Milan Foods (FoodExp$) • Population Statistics • Population Mean = $43.30 • SD of pop est = 20.91 • If population statistics are known, we can make some calculations about the distribution of sample means • If Sample Size (n) = 100 • SE = SD/sqrt(100) = 20.91/10=$2.09 • 95% of all sample means are within 1.96 SE, or … $43.30 +/- (1.96*2.09): = $39.20 - $47.40
Milan Foods: Example of SE (n=100) • In practice we will rarely know the population statistics so we will use the sample statistics as estimates • Sample size = 100 • Sample mean = $42.41, • Sample SD = 18.34 • Calculate SE and CI, population statistics unknown • SE = SD/sqrt(100) = 18.34/10=$1.834 • 95% of all intervals we could construct under this sampling plan will contain the true pop. value, … $42.41 +/- (1.98*1.834): $38.78 - $46.04
Milan Foods: Example of SE (n=25) • Sample size = 25 • Sample mean = $45.10, • Sample SD = 18.13 • Calculate SE population statistics unknown • SE = SD/sqrt(25) = 18.13/5=$3.26
MILAN FOODS • Simple Random, SE (for n = 25) = 20.91/sqrt(25) = 4.18 • Simple Random, SE (for n = 100) = 2.09(4x n to ½ SE) • Stratified on I (Any Kids 6-18), SE (for n=100) = 1.91 • Stratified on C (Number in Household), SE (for n = 100) = 1.88
Milan – Food Exp SPSS Box Plot Potential “Outliers” Top 25% Middle 50% Median Bottom 25%
Non-Probability Samples • Convenience • Quota • Sample matches population on key control characteristics correlated with behavior under study. However, sample matches only for control variables related to thing you are trying to estimate (like number of kids and food consumption). Other variables may not match and be representative.
Sampling Errors vs. Biases • Sampling Error: the error caused by observing a sample instead of the whole population. Estimates are always subject to natural sample to sample variation (random error). • Sample Biases: Expected value differs from true value because of unwitting under-sampling or oversampling of certain types of sampling elements