Download
1 / 16
160 likes | 276 Views
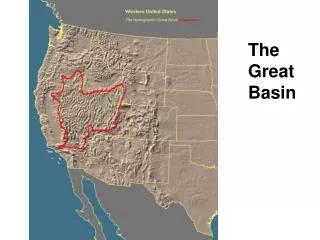
Modeling Ecological and Economic Benefits of Post-Fire Revegetation in the Great Basin. Becky Niell. Brief Ecological History of Sagebrush-Steppe. Historically co-dominated by native bunchgrasses and sagebrush Cattle grazing (1850’s) decline of native bunchgrasses & increase in sagebrush

E N D
Modeling Ecological and Economic Benefits of Post-Fire Revegetation in the Great Basin Becky Niell
Brief Ecological History of Sagebrush-Steppe • Historically co-dominated by native bunchgrasses and sagebrush • Cattle grazing (1850’s) decline of native bunchgrasses & increase in sagebrush • Cheatgrass invasion (early 1900’s) increased fire frequency & changed successional patterns
Ramifications of Ecological Change • invasion of nonnative plant • species • loss of native shrublands • increased fire frequency • loss of native biodiversity • reduced forage for livestock • increased management costs • decreased water quality • reduced recreation values
What to do…… • Aggressive management is needed …. • Revegetation • Crested wheatgrass • Native seed Constrained by lack of information & high costs.
Need: • “predictive models to forecast the potential effects of various management actions on resources” • “economic models that can put restoration costs and benefits into a framework that will support choosing among restoration alternatives as well as explaining benefits to the public and other constituents (BLM 2000).”
State-and-transition model(conceptual model) Markov chain model(quantitative, dynamic model) • Predict long term vegetation change • Predict costs and benefits of revegetation strategies
2. NativePerennial Bunchgrass - Sagebrush 3. Sagebrush- Native Perennial Bunchgrass 4. DenseSagebrush- Sparse Bunchgrass Cheatgrass Understory 1. Native Perennial Bunchgrass Dominant 5. DenseSagebrush w/ Cheatgrass Understory 11. Sagebrush - Introduced Perennial Bunchgrass 6. Cheatgrass Dominant w/ Sagebrush 10. IntroducedPerennial Bunchgrass - Sagebrush 7. Cheatgrass w/ Sagebrush seedlings & rootsprouting shrubs 9. Introduced Perennial Bunchgrass Dominant 8. Cheatgrass Monoculture Natural Succession Fire Event Fire Event with Revegetation State Transition Wyoming Big Sagebrush Vegetation in the Great Basin with grazing and cheatgrass present. (8-10 inch precipitation zone)
Average Transition Times Between Vegetation Types Average Fire Frequencies
No reveg. Reveg. 150 year simulation of Cheatgrass Monoculture: t = 0 t = 20 t = 150 31 - 41% 35 - 51% w/ revegetation 25% 40 - 69% 78 - 89% no revegetation
Immediate Action Needed!! Without revegetation: 40 – 69% of the landscape cheatgrass monoculture or worse in 20 years. 1/20 to 1/3 of landscape burning every year… Costs…. Revegetation is not cheap: $25-100+ /acre (1.7 million acres burned in 1999)
So… What are economic and ecological trade-offs of different post-fire revegetation strategies? • Reducing cheatgrass monoculture • Maintaining native vegetation • Minimizing management costs
Area of Cheatgrass Monoculture (% of landscape) 50 YEAR RESULTS: Goal 1. Reduce Area of Cheatgrass Monoculture: • No revegetation (71%) • Native seed (42%) * • CWG (42%) * Area of Native Vegetation (% of landscape) Goal 2. Increase Area of Native Vegetation: • No revegetation (10%) • Native seed (42%) * • CWG (10%)
Average Management Costs ($ / 100 ac.) Goal 3. Minimize Management Costs: • No revegetation ($7.83/ac) • Native seed ($6.64/ac) • CWG ($6.00/ac) * • Management costs = fire suppression costs + reveg. costs Revegetation can cost 1.9 times more per acre than fire suppression and still cost less than no revegetation in the long run!!
Conclusions: • 1) No revegetation Ecological and economic disaster • 2) Post-fire revegetation was more effective than no revegetation for: • achieving ecosystem objectives • reducing costs • 3) The appropriate choice of seed mix depends on the prioritization of management objectives • native seed costs more than crested wheatgrass seed • native seed was equally or more effective for achieving each ecosystem goal • 4) Post-fire revegetation is not sufficient!