Download

1 / 16
160 likes | 257 Views
This presentation explores the injury problem in Ontario, analyzing data from NACRS and DAD databases to describe variation by age, gender, SES, and geographic location. It covers mechanisms of injury, diagnoses, and sociodemographic information, highlighting strengths and limitations of the data.

E N D
Population-based injury data in Ontario Presentation for ICE meeting Washington, September 7, 2006 Alison K. Macpherson, PhD Assistant Professor School of Kinesiology and Health Science York University
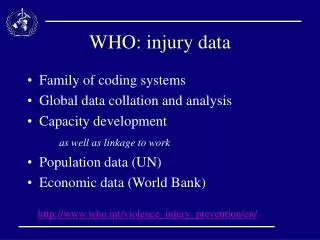
Sources of data • National ambulatory care reporting system (NACRS) database • Includes all patients reporting to ED in Ontario • Reporting required by government in the context of a one-party payment system (universal healthcare) • Coded by nosologists using a standardized process • Uses international classification system (ICD-10-CA) • Includes unique identifier (scrambled OHIP number)
Sources of data (2) • Discharge Abstract Database (DAD) • Includes all patients hospitalized in Ontario • Can be linked to NACRS by unique identifier • Uses international classification system (ICD-10) • Both datasets include: • mechanism of injury • geographic indicators • Diagnoses (ICD-10) • sociodemographic information
Injuries in Ontario: An ICES Research Atlas • Objective: To describe the injury problem in Ontario, paying special attention to variation by: • Age • Gender • SES • Geographic location • Mechanism of injury
Methods • National ambulatory care reporting system (NACRS) database linked with Discharge Abstract Database (DAD) • One year (2002-2003) • All patients reporting to ED in Ontario • Grouped by • county (49 in Ontario) • SES based on average family income in the residential census tract
Variable definition • Injury variable- Diagnosis (ICD-10 codes)- Visits with an e-code and a trauma diagnosis included • Grouped according to ICE categories for cause: • Falls • Motor vehicle crashes • Bicycle-related injuries • Pedestrian injuries • Overexertion • Drowning • -etc….
12,068,300 Population of Ontario 4,921,085 Number of ED visits 1,211,550 ED visits for injury (25% of ED visits)
Results • 1.2 million ED visits for an injury in one year • 13,678/100,000 injury rate • 62,377 (2.6%) admitted to hospital • 2700 (0.02%) died in hospital
How do NACRS and DAD compare for injury admissions > 3 days?
Strengths and Limitations of Ontario injury data Strengths • Population-based study • Linked data • Coded using standardized practices Limitations • Administrative data • Possibility of coding errors • Variation in injury rates may partially reflect variation in ED visits
Conclusions • Ontario has rich sources of injury data • Can be used for local planning and international comparisons • Linkable data can help with validation for ICE injury projects • Atlas exhibits available at www.ices.on.ca under publications