Recombination based population genomics
400 likes | 724 Views
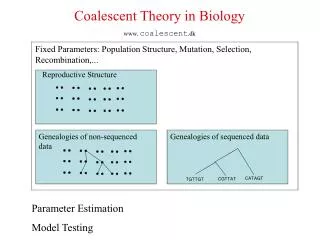
Recombination based population genomics. Jaume Bertranpetit Marta Melé Francesc Calafell . Asif Javed Laxmi Parida. Recall: IRiS. Identification of Recombinations in Sequences IRiS is a computational method developed with biological insight detects evidence of historical recombinations

Recombination based population genomics
E N D
Presentation Transcript
Recombination based population genomics Jaume Bertranpetit Marta Melé Francesc Calafell Asif Javed Laxmi Parida
Recall: IRiS Identification of Recombinations in Sequences IRiS • is a computational method developed with biological insight • detects evidence of historical recombinations • minimizes number of recombinations in Ancestral Recombinational Graph (ARG)
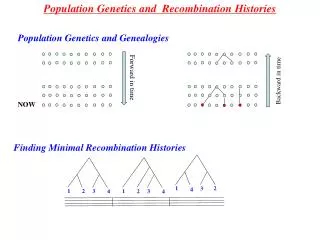
Recotypes Two chromosomes share a recombination if the junction is co-inherited. mutation edge recombinationedge extantsequence
Recotypes Two chromosomes share a recombination if the junction is co-inherited. r1 a b
Recotypes Two chromosomes share a recombination if the junction is co-inherited. r1 r2 c a b
Recotypes Two chromosomes share a recombination if the junction is co-inherited. r1 r2 c a b
Validity of inferred recombinations • Comparison with sperm typing • Computer simulated recombinations
in vitro Chr 1 near MS32 minisatellite Jeffreys et al. 2005 80 UK semen donor of North European origin - Sperm typing- LDhat and Phase (200 SNPs) spermtyping LDhatPhase HapMap 2 CEU populationsimilar SNP density IRiS
in silico Chromosomes • HapMap 3 X chromosome data • Select 2 chromosomes at random. • Pick a random breakpoint. • Create a new chromosome. • Check if it is unique, add to the dataset. • Run IRiS on the dataset to see if the breakpoint is detected.
in silico Chromosomes • HapMap 3 X chromosome data • Select 2 chromosomes at random. • Pick a random breakpoint. • Create a new chromosome. • Check if it is unique, add to the dataset. • Run IRiS on the dataset to see if the breakpoint is detected.
in silico Chromosomes • HapMap 3 X chromosome data • Select 2 chromosomes at random. • Pick a random breakpoint. • Create a new chromosome. • Check if it is unique, add to the dataset. • Run IRiS on the dataset to see if the breakpoint is detected.
in silico Chromosomes • HapMap 3 X chromosome data • Select 2 chromosomes at random. • Pick a random breakpoint. • Create a new chromosome. • Check if it is unique, add to the dataset. • Run IRiS on the dataset to see if the breakpoint is detected.
in silico Chromosomes • HapMap 3 X chromosome data • Select 2 chromosomes at random. • Pick a random breakpoint. • Create a new chromosome. • Check if it is unique, add to the dataset. • Run IRiS on the dataset to see if the breakpoint is detected.
in silico Chromosomes • HapMap 3 X chromosome data • Select 2 chromosomes at random. • Pick a random breakpoint. • Create a new chromosome. • Check if it is unique, add to the dataset. • Run IRiS on the dataset to see if the breakpoint is detected. IRiS recombination detected?
in silico Chromosomes • HapMap 3 X chromosome data • Select 2 chromosomes at random. • Pick a random breakpoint. • Create a new chromosome. • Check if it is unique, add to the dataset. • Run IRiS on the dataset to see if the breakpoint is detected. IRiS recombination detected? 69% recombinations detectedAll detected recombinations detect the correct sequenceNo false positives
Recombinomics • Strong population structure • Agreement with traditional methods • FST vs. recombinational distance • More informative than SNPs • STRUCTURE • PCA
Regions 18 regions selected from HapMap 3 • X-chromosome in males (to avoid phasing errors) • 50 KB away from known CNV and SD(to avoid genotyping errors) • 50 KB away from genes(to avoid selection) • at least 80 SNPs Chromosomes: LWK(43), MKK (88), YRI (88), ASW (42), GIH (42), CHB (40), CHD (21), JPT(25), MEX(21), CEU (74), TSI (40)
Analysis For each region IRiS inferred recotypes for each chromosome • 5166 recombinations were inferred • 3459 co-occurred in at least two chromosomes Recombination Chromosome
Analysis For each region IRiS inferred recotypes for each chromosome • 5166 recombinations were inferred • 3459 co-occurred in at least two chromosomes Recombination Chromosome Recotype
Agreement with LDhat Each point represents a short haplotype segment in HapMap CEU population Spearman correlation= 0.711pvalue <10-30 recombination rate inferred by LDhat number of recombinations inferred by IRiS
Agreement with LDhat Each point represents a short haplotype segment in HapMap CEU population Spearman correlation= 0.711pvalue <10-30 recombination rate inferred by LDhat Correlation in hotspots c2 = 38.39 pvalue<6x10⁻¹⁰ number of recombinations inferred by IRiS
Recombinational distance between populations Two populations genetically closer will share a higher number of recombinations Recombinational distance Correlation between FST distance and recombinational distance for the 18 region [0.35 – 0.75 ] with pvalues < 0.025 RAB DAB = 1 - RA + RB -RAB MDS All regions combined stress=6.1%
PCA of population data Recall recotypes
PCA of population data Recall recotypes
PCA of population data The first two PCs capture 66.4% of the variance
PCA of recotypes • more on this later
Recotypes vs. SNPs Due to ascertainment bias gene diversity does not reflect population structure results similar to Conrad 07 Percentage of variance Normalized comparison linearly scaled to [0,1] using 21 samples per population in agreement with Lewontin 72
from SNPs to haplotypes to recotypes(a STRUCTURE comparison) K=2 SNPs haplotypes recotypes
from SNPs to haplotypes to recotypes(a STRUCTURE comparison) K=3 SNPs haplotypes recotypes
from SNPs to haplotypes to recotypes(a STRUCTURE comparison) K=4 SNPs haplotypes recotypes
from SNPs to haplotypes to recotypes(a STRUCTURE comparison) K=5 SNPs haplotypes recotypes
Africa within global genetic variation Structure k=4 minority African specific component Avg. Number of recombinations in 21 random chromsomes Out of Africa hypothesisFounder’s effect
Genetic variation within Africa Structure k=5 Maasai specificminor component • Subsaharan Maasai are distinct among Africans. • African-American exhibit stronger recombinational affinity with African populations than European populations. (Parra 98)
Genetic variation outside Africa Structure k=5 Avg. Number of recombinations in 21 random chromsomes • Outside Africa, Gujarati and Japanese exhibit the highest and lowest number of recombinations respectively. • Gujarati Indians show intermediate position between Europeans and East Asians.
Venturing outside the X-chromosome • Benefits • The bigger picture • More regions and hence more information • Challenges • Higher number of recombinations makes the picture murkier • Phasing errors
Regions 81 regions selected from HapMap 3 • 50 KB away from known CNV and SD(to avoid genotyping errors) • 50 KB away from genes(to avoid selection) • at least 200 SNPs • 25 samples per population(each sample has twochromosomes)
Analysis • For each region IRiS inferred recotypes for each chromosome • 34140 recombinations were inferred • For each sample the two recotypes were merged. SNPs recotypes PCA plots
Quantifying population structure • PCA and by k nearest neighbors is used to predict population of every sample Perfectly classified Africans Non- Africans classifiedwith errors MKK GIH E. Asian MEX European (0,7) (3,13) (8,13) LKK (4,3) CHB+CHD JPT CEU TSI ASW YRI Misclassification by (recotypes, SNPs)
East Asian population Recotypes are more informative of underlying population structure. SNPs recotypes PCA plots
in conclusion … Recotypes • show strong agreement with in silico and in vetro recombination rates estimates • are highly informative of the underlying population structure • provide a novel approach to study the recombinational dynamics