Download
1 / 10
100 likes | 177 Views
Explore the importance of population-based data in Poverty Reduction Strategy Papers (PRS) focusing on MDGs as a policy platform. Learn about challenges in operationalizing MDGs, inequality issues, and improving health outcomes for the poorest quintile. Discover strategies for data collection collaboration and addressing statistical capacity challenges.

E N D
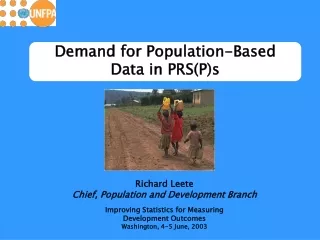
Demand for Population-Based Data in PRS(P)s Richard Leete Chief, Population and Development Branch Improving Statistics for Measuring Development Outcomes Washington, 4-5 June, 2003
Demand for Population-Based Data in PRS(P)s MDGs as Platform for Policy and Programmatic Focus in PRS(P)s • MDGs squarely at forefront of global development agenda and unifying tool for the UN System • MDG targets combined with ICPD RH goal a natural platform and entry point for UN engagement in PRS(P)s • capture multidimensionality of poverty • support rights-based approach to development
Demand for Population-Based Data in PRS(P)s Challenges in Operationalising MDGs in PRS(P)s • Weak statistical systems • Capacity constraints and • Ad hoc nature of data collection • Localising targets and broading ownership • Translating global targets into national targets • Disaggregating and ‘en-gendering’ indicators • Sex; urban/rural and poor/rich, etc • Gender important for each MDG • Building partnerships for data collection • Broad participation of primary stakeholders and pooling resources
Demand for Population-Based Data in PRS(P)s UNFPA Review of 27 PRSPs (i) • Unrealistic target setting, incl. MMR targets including in all 27 PRSPs • Slowly changing indicator • Difficult to detect changes because of infrequency of event • Lack of appreciation of resources needed (financial/non-financial) to meet targets
Demand for Population-Based Data in PRS(P)s UNFPA Review of 27 PRSPs (ii) • Use of indicators that are not readily measurable or interpreted including in relation to HIV/AIDS eg • Condom use at last high risk sex based on data collected in DHS type surveys • Lack of focus on poor in target setting • Focus almost exclusively on national averages • Limited use of poverty mapping: population based indicators combined with physical facilities
Demand for Population-Based Data in PRS(P)s Equality and Non-Discrimination • Huge poor-rich differentials in population and social outcomes • differentials in access and quality of basic social services • Resource gaps, financial and human, to supply basic social services • Lack of political will • an artificial ‘north’ in South, akin to North: affluent urban elites and institutional resistance towards pro-poor resource allocations • Need pro-poor social sector budgets and to target interventions towards poor
Richest quintile Poorest quintile Proportion Currently Married Women Using Modern Contraception Demand for Population-Based Data in PRS(P)s Contraceptive Prevalence Rates richest and poorest quintiles, 11 Countries mid-1990s to 2000
Demand for Population-Based Data in PRS(P)s Good Example of Use of Population Data in PRSPs - Azerbaijan
More equal access 4 outliers Improvement for poorest and more equal access Improvement for poorest but less equal access Burkina Faso Egypt Cameroon Morocco Senegal Togo Zambia Zimbabwe Bolivia Brazil NE Deterioration access for poorest Improvement access for poorest Colombia Dominican Rep. Guatemala Indonesia Deterioration for poorest and less equal access Deterioration for poorest but more equal access x axis: % change in access of poorest 20% to skilled attendants y axis: % change in ratio of access between richest and poorest 20% to skilled attendants Kenya Mali Tanzania Uganda Peru Bangladesh 1 outlier Less equal access Kazakhstan Demand for Population-Based Data in PRS(P)s Have Health Outcomes Improved for the Poorest Quintile and Become More Equitable over the 1990s? Skilled Birth Attendants, DHS in 21 countries In absolute terms,average access increased in 13 of 21 countries: in 14 poorest quintile gained .
Demand for Population-Based Data in PRS(P)s A Way Forward • Increasing common ground in aim to eradicate poverty and consensus around MDGs provide new partnership opportunities for jointly addressing statistical capacity challenges • centralising and mainstreaming data collection within NSOs • meeting demand for poverty data through pooling of national and donor resources and ensuring continuity of support