Download
1 / 28
280 likes | 397 Views
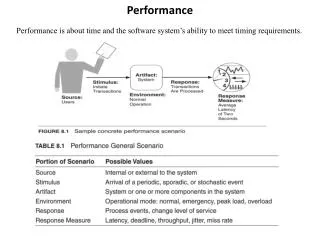
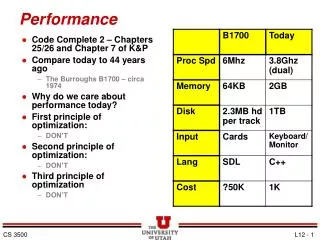
Performance. ICS 233 Computer Architecture and Assembly Language Dr. Aiman El-Maleh College of Computer Sciences and Engineering King Fahd University of Petroleum and Minerals [Adapted from slides of Dr. M. Mudawar, ICS 233, KFUPM]. Outline. Response Time and Throughput

E N D
Performance ICS 233 Computer Architecture and Assembly Language Dr. Aiman El-Maleh College of Computer Sciences and Engineering King Fahd University of Petroleum and Minerals [Adapted from slides of Dr. M. Mudawar, ICS 233, KFUPM]
Outline • Response Time and Throughput • Performance and Execution Time • Clock Cycles Per Instruction (CPI) • MIPS as a Performance Measure • Amdahl’s Law • Benchmarks • Performance and Power
What is Performance? • How can we make intelligent choices about computers? • Why some computer hardware performs better at some programs, but performs less at other programs? • How do we measure the performance of a computer? • What factors are hardware related? software related? • How does machine’s instruction set affect performance? • Understanding performance is key to understanding underlying organizational motivation
Response Time and Throughput • Response Time • Time between start and completion of a task, as observed by end user • Response Time = CPU Time + Waiting Time (I/O, OS scheduling, etc.) • Throughput • Number of tasks the machine can run in a given period of time • Decreasing execution time improves throughput • Example: using a faster version of a processor • Less time to run a task more tasks can be executed • Increasing throughput can also improve response time • Example: increasing number of processors in a multiprocessor • More tasks can be executed in parallel • Execution time of individual sequential tasks is not changed • But less waiting time in scheduling queue reduces response time
1 PerformanceX = Execution timeX PerformanceX Execution timeY = = n PerformanceY Execution timeX Book’s Definition of Performance • For some program running on machine X • X is n times faster than Y
What do we mean by Execution Time? • Real Elapsed Time • Counts everything: • Waiting time, Input/output, disk access, OS scheduling, … etc. • Useful number, but often not good for comparison purposes • Our Focus: CPU Execution Time • Time spent while executing the program instructions • Doesn't count the waiting time for I/O or OS scheduling • Can be measured in seconds, or • Can be related to number of CPU clock cycles
Cycle 1 Cycle 2 Cycle 3 CPU Execution Time = CPU cycles × cycle time CPU cycles = Clock rate Clock Cycles • Clock cycle = Clock period = 1 / Clock rate • Clock rate = Clock frequency = Cycles per second • 1 Hz = 1 cycle/sec 1 KHz = 103 cycles/sec • 1 MHz = 106 cycles/sec 1 GHz = 109 cycles/sec • 2 GHz clock has a cycle time = 1/(2×109) = 0.5 nanosecond (ns) • We often use clock cycles to report CPU execution time
Improving Performance • To improve performance, we need to • Reduce number of clock cycles required by a program, or • Reduce clock cycle time (increase the clock rate) • Example: • A program runs in 10 seconds on computer X with 2 GHz clock • What is the number of CPU cycles on computer X ? • We want to design computer Y to run same program in 6 seconds • But computer Y requires 10% more cycles to execute program • What is the clock rate for computer Y ? • Solution: • CPU cycles on computer X = 10 sec × 2 × 109 cycles/s = 20 × 109 • CPU cycles on computer Y = 1.1 × 20 × 109 = 22 × 109 cycles • Clock rate for computer Y = 22 × 109 cycles / 6 sec = 3.67 GHz
I1 I2 I3 I4 I5 I6 I7 cycles 1 2 3 4 5 6 7 8 9 10 11 12 13 14 Clock Cycles Per Instruction (CPI) • Instructions take different number of cycles to execute • Multiplication takes more time than addition • Floating point operations take longer than integer ones • Accessing memory takes more time than accessing registers • CPI is an average number of clock cycles per instruction • Important point Changing the cycle time often changes the number of cycles required for various instructions (more later) CPI = 14/7 = 2
Performance Equation • To execute, a given program will require … • Some number of machine instructions • Some number of clock cycles • Some number of seconds • We can relate CPU clock cycles to instruction count • Performance Equation: (related to instruction count) CPU cycles = Instruction Count × CPI Time = Instruction Count × CPI × cycle time
Factors Impacting Performance Time = Instruction Count × CPI × cycle time
550 × I 500 × I Using the Performance Equation • Suppose we have two implementations of the same ISA • For a given program • Machine A has a clock cycle time of 250 ps and a CPI of 2.2 • Machine B has a clock cycle time of 500 ps and a CPI of 1.0 • Which machine is faster for this program, and by how much? • Solution: • Both computers execute same count of instructions = I • CPU execution time (A) = I × 2.2 × 250 ps = 550 × I ps • CPU execution time (B) = I × 1.0 × 500 ps = 500 × I ps • Computer B is faster than A by a factor = = 1.1
n ∑ CPI = (CPIi × Ci) CPU cycles = (CPIi × Ci) i = 1 n ∑ n ∑ Ci i = 1 i = 1 Determining the CPI • Different types of instructions have different CPI Let CPIi = clocks per instruction for class i of instructions Let Ci = instruction count for class i of instructions • Designers often obtain CPI by a detailed simulation • Hardware counters are also used for operational CPUs
Example on Determining the CPI • Problem A compiler designer is trying to decide between two code sequences for a particular machine. Based on the hardware implementation, there are three different classes of instructions: class A, class B, and class C, and they require one, two, and three cycles per instruction, respectively. The first code sequence has 5 instructions: 2 of A, 1 of B, and 2 of C The second sequence has 6 instructions: 4 of A, 1 of B, and 1 of C Compute the CPU cycles for each sequence. Which sequence is faster? What is the CPI for each sequence? • Solution CPU cycles (1st sequence) = (2×1) + (1×2) + (2×3) = 2+2+6 = 10 cycles CPU cycles (2nd sequence) = (4×1) + (1×2) + (1×3) = 4+2+3 = 9 cycles Second sequence is faster, even though it executes one extra instruction CPI (1st sequence) = 10/5 = 2 CPI (2nd sequence) = 9/6 = 1.5
Second Example on CPI Given: instruction mix of a program on a RISC processor What is average CPI? What is the percent of time used by each instruction class? Classi Freqi CPIi ALU 50% 1 Load 20% 5 Store 10% 3 Branch 20% 2 %Time 0.5/2.2 = 23% 1.0/2.2 = 45% 0.3/2.2 = 14% 0.4/2.2 = 18% CPIi × Freqi 0.5×1 = 0.5 0.2×5 = 1.0 0.1×3 = 0.3 0.2×2 = 0.4 Average CPI = 0.5+1.0+0.3+0.4 = 2.2 How faster would the machine be if load time is 2 cycles? What if two ALU instructions could be executed at once?
Instruction Count Clock Rate Inst Count Inst Count × CPI Execution Time × 106 CPI × 106 MIPS × 106 Clock Rate MIPS = = Execution Time = = MIPS as a Performance Measure • MIPS: Millions Instructions Per Second • Sometimes used as performance metric • Faster machine larger MIPS • MIPS specifies instruction execution rate • We can also relate execution time to MIPS
Drawbacks of MIPS Three problems using MIPS as a performance metric • Does not take into account the capability of instructions • Cannot use MIPS to compare computers with different instruction sets because the instruction count will differ • MIPS varies between programs on the same computer • A computer cannot have a single MIPS rating for all programs • MIPS can vary inversely with performance • A higher MIPS rating does not always mean better performance • Example in next slide shows this anomalous behavior
MIPS example • Two different compilers are being tested on the same program for a 4 GHz machine with three different classes of instructions: Class A, Class B, and Class C, which require 1, 2, and 3 cycles, respectively. • The instruction count produced by the first compiler is 5 billion Class A instructions, 1 billion Class B instructions, and 1 billion Class C instructions. • The second compiler produces 10 billion Class A instructions, 1 billion Class B instructions, and 1 billion Class C instructions. • Which compiler produces a higher MIPS? • Which compiler produces a better execution time?
Solution to MIPS Example • First, we find the CPU cycles for both compilers • CPU cycles (compiler 1) = (5×1 + 1×2 + 1×3)×109 = 10×109 • CPU cycles (compiler 2) = (10×1 + 1×2 + 1×3)×109 = 15×109 • Next, we find the execution time for both compilers • Execution time (compiler 1) = 10×109 cycles / 4×10⁹ Hz = 2.5 sec • Execution time (compiler 2) = 15×109 cycles / 4×10⁹ Hz = 3.75 sec • Compiler1 generates faster program (less execution time) • Now, we compute MIPS rate for both compilers • MIPS = Instruction Count / (Execution Time × 106) • MIPS (compiler 1) = (5+1+1) × 109 / (2.5 × 10⁶) = 2800 • MIPS (compiler 2) = (10+1+1) × 109 / (3.75 × 10⁶) = 3200 • So, code from compiler 2 has a higher MIPS rating !!!
Performance with E ExTime before Performance before ExTime with E Speedup(E) = = 1 Speedup(E) = (f / s + (1 – f )) Amdahl’s Law • Amdahl's Law is a measure of Speedup • How a computer performs after an enhancement E • Relative to how it performed previously • Enhancement improves a fraction f of execution time by a factor s and the remaining time is unaffected ExTime with E = ExTime before × (f / s + (1 – f ))
Example on Amdahl's Law • Suppose a program runs in 100 seconds on a machine, with multiply responsible for 80 seconds of this time. How much do we have to improve the speed of multiplication if we want the program to run 4 times faster? • Solution: suppose we improve multiplication by a factor s 25 sec (4 times faster) = 80 sec / s + 20 sec s = 80 / (25 – 20) = 80 / 5 = 16 Improve the speed of multiplication by s = 16 times • How about making the program 5 times faster? 20 sec ( 5 times faster) = 80 sec / s + 20 sec s = 80 / (20 – 20) = ∞ Impossible to make 5 times faster!
Benchmarks • Performance best obtained by running a real application • Use programs typical of expected workload • Representatives of expected classes of applications • Examples: compilers, editors, scientific applications, graphics, ... • SPEC (System Performance Evaluation Corporation) • Funded and supported by a number of computer vendors • Companies have agreed on a set of real programs and inputs • Various benchmarks for … CPU performance, graphics, high-performance computing, client-server models, file systems, Web servers, etc. • Valuable indicator of performance (and compiler technology)
The SPEC CPU2000 Benchmarks • Wall clock time is used as metric • Benchmarks measure CPU time, because of little I/O
1 4 0 0 1 2 0 0 P e n t i u m 4 C F P 2 0 0 0 1 0 0 0 P e n t i u m 4 C I N T 2 0 0 0 8 0 0 6 0 0 P e n t i u m I I I C I N T 2 0 0 0 4 0 0 P e n t i u m I I I C F P 2 0 0 0 2 0 0 0 5 0 0 1 0 0 0 1 5 0 0 2 0 0 0 2 5 0 0 3 0 0 0 3 5 0 0 C l o c k r a t e i n M H z SPEC 2000 Ratings (Pentium III & 4) Note the relative positions of the CINT and CFP 2000 curves for the Pentium III & 4 SPEC ratio = Execution time is normalized relative to Sun Ultra 5 (300 MHz) SPEC rating = Geometric mean of SPEC ratios Pentium III does better at the integer benchmarks, while Pentium 4 does better at the floating-point benchmarks due to its advanced SSE2 instructions
Performance and Power • Power is a key limitation • Battery capacity has improved only slightly over time • Need to design power-efficient processors • Reduce power by • Reducing frequency • Reducing voltage • Putting components to sleep • Energy efficiency • Important metric for power-limited applications • Defined as performance divided by power consumption
1 . 6 P e n t i u m M @ 1 . 6 / 0 . 6 G H z P e n t i u m 4 - M @ 2 . 4 / 1 . 2 G H z 1 . 4 P e n t i u m I I I - M @ 1 . 2 / 0 . 8 G H z 1 . 2 1 . 0 Relative Performance 0 . 8 0 . 6 0 . 4 0 . 2 0 . 0 S P E C I N T 2 0 0 0 S P E C F P 2 0 0 0 S P E C I N T 2 0 0 0 S P E C F P 2 0 0 0 S P E C I N T 2 0 0 0 S P E C F P 2 0 0 0 Always on / maximum clock Laptop mode / adaptive clock Minimum power / min clock Benchmark and Power Mode Performance and Power
Pentium M @ 1.6/0.6 GHz Pentium 4-M @ 2.4/1.2 GHz Pentium III-M @ 1.2/0.8 GHz Relative Energy Efficiency SPECINT 2000 SPECFP 2000 SPECINT 2000 SPECFP 2000 SPECINT 2000 SPECFP 2000 Always on / maximum clock Laptop mode / adaptive clock Minimum power / min clock Benchmark and power mode Energy Efficiency Energy efficiency of the Pentium M is highest for the SPEC2000 benchmarks
Things to Remember • Performance is specific to a particular program • Any measure of performance should reflect execution time • Total execution time is a consistent summary of performance • For a given ISA, performance improvements come from • Increases in clock rate (without increasing the CPI) • Improvements in processor organization that lower CPI • Compiler enhancements that lower CPI and/or instruction count • Algorithm/Language choices that affect instruction count • Pitfalls (things you should avoid) • Using a subset of the performance equation as a metric • Expecting improvement of one aspect of a computer to increase performance proportional to the size of improvement