Performance
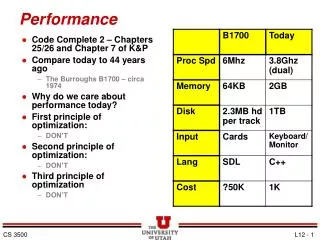
Performance. Tools and guides to fast rendering. Android Debug Bridge (adb). Versatile command line tool Communicate with Android devices: Logcat Download / Upload files Shell Remote access …. LOGCAT. Logcat is the debug spew from an Android app. You will use this

Performance
E N D
Presentation Transcript
Performance • Tools and guides to fast rendering
Android Debug Bridge (adb) • Versatile command line tool • Communicate with Android devices: • Logcat • Download / Upload files • Shell • Remote access • …
LOGCAT • Logcat is the debug spew from • an Android app. You will use this • liberally to keep track of what the • OS and your app are doing. • You can use the logcat window in Eclipse • You can fire up your own window via adb. • Yes, this is in fact, printf-like output. • albeit – you do have some ability to filter messages
HAXM • Intel® Hardware Accelerated Execution Manager • The Intel Hardware Accelerated Execution Manager is a hardware-assisted virtualization engine (hypervisor) that uses Intel Virtualization Technology (Intel® VT) to speed up Android app emulation on a host machine. It makes the emulator a lot faster! • Easy to use • You need to have the Android SDK installed. • Your computer must have an Intel processor with support for Intel VT-x, EM64T and Execute Disable(XD) Bit functionality enabled from the BIOS.
gdb • gdb – the GNU Debugger • GDB allows you to do run the program, set breakpoints, print out the values of certain variables at that point, or step through the program one line at a time and print out the values of each variable after executing each line. • It’s a command line debugger, and yes, it generally sucks to use. • There is a big list of GDB commands but following commands are among the more useful gdb commands: b main - Put a breakpoint at the beginning of the program b - Put a breakpoint at the current line b N - Put a breakpoint at line N b +N - Put a breakpoint N lines down from the current line b fn - Put a breakpoint at the beginning of function "fn" d N - delete breakpoint number N info break - list breakpoints r - Run the program until a breakpoint or error c - continue running until the next breakpoint or error f - Run until the current function is finished s - run the next line of the program s N - run the next N lines of the program n - like s, but don't step into functions u N - run until you get N lines in front of the current line p var - print the current value of the variable "var" bt - print a stack trace u - go up a level in the stack d - go down a level in the stack q - Quit gdb
Performance Optimizations • Vertex Data • Use the minimum vertex data size • Load on GPU if possible • Use indexed variables • DON’T use long triangles • DON’T use huge triangles • Set a vertex limit for artists • Try to define a fixed set of vertex attribute formats
Performance Optimizations • Shaders • Use the vertex shader over the fragment shader • Use Uniforms over vertex shader • Compress data as much as possible • Load on GPU if possible • Use indexed variables • Sort rendering by shaders
Performance Optimizations • Generic • Bandwidth is a performance killer • Tailor texture sizes to usage • Don’t use more than 4 textures in a shader • Use LOD objects • Don’t render tiny/invisible things • Make performance measurements part of your build process • Learn to use a performance tool!
Links to Tools and Articles • Links on Android and OpenGL-ES Programming • developer.android.com- Official developer site • developers.google.com/android/ - Google on Android • developers.google.com/events/io/ - Google I/O Replays • developer.android.com/guide/topics/graphics/opengl.html - Android OpenGL-ES page • www.khronos.org/opengles/- Khronos – Official OpenGL-ES site • stackoverflow.com- Active Q&A community for Android/OpenGL-ES • Creating a Native App in Android • software.intel.com/en-us/articles/android-application-development-and-optimization-on-the-intel-atom-platform • software.intel.com/en-us/articles/setting-up-native-opengl-es-on-android-platforms • www.techrepublic.com/blog/android-app-builder/introduction-to-android-native-development/
Thank You!Please send us feedback on what you liked, disliked, would like to see next.ModernOpenGL.comron@directx.com rudycazabon@gmail.com