Download
1 / 22
220 likes | 314 Views
Learn how income tax, negative gearing, capital gains tax, land tax, and other factors influence housing affordability for landlords and homeowners. Understand the implications for investment decisions and property prices.

E N D
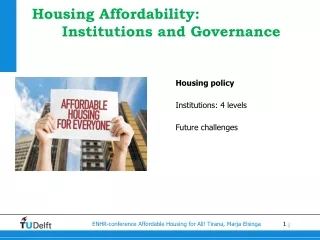
How our tax system affects housing affordability Rachel Ong Deputy Director of Centre for Research in Applied Economics Curtin University
Income tax on landlords • Rental income is tax assessable income • Deductions • Capital works deduction = 2.5% of the cost of construction and improvements to rental properties that commenced after July 1985 • Depreciation on fixtures and fittings • Rental interest
Negative gearing • Net rental income is tax assessable • Negative gearing - Net rental loss can be deducted against tax assessable income Individual Landlords’ Rental Income and Deductions, 2005–06 and 2006–07 ATO Taxation Statistics (2006-07), Personal Tax, Table 2.4
Negative gearing • Attractive to investors – tax shelter benefits but • Refinancing and churning required to retain tax shelter benefits • Detrimental to tenure security • Encourages the accumulation of wealth through borrowing and speculation – can lead to inflationary bias
Survival rate (%) 1 0.9 0.8 0.7 0.6 Not negatively geared 0.5 0.4 0.3 Negatively geared 0.2 0 1 2 3 4 5 Negative gearing Year Wood and Ong (2010)
Capital gains tax • Landlords subject to CGT on sale of property • Discount on CGT • 50% discount for individual landlords • 33.3% for superannuation funds that hold investment properties • No discount for companies • Individual landlords have incentives to debt finance to chase capital gains • Properties with large capital gains tend to be in higher segments of the property market
Land tax • Recurrent annual tax levied investors who own land used for private rental housing • Progressive schedule with marginal rates that increase with the value of the land • Tax base is on aggregate land holding • Multiple property owners are taxed on the aggregate value of their land plots, pushing them into land tax brackets with high marginal rates
WA 2011-12 land tax rates Land tax $0 - $300,000 Nil If 1 land plot worth $300,000, • land tax = $0 If 4 land plots worth $300,000 each, • aggregate land value = $1,200,000 • land tax = $630 + 0.0047 x (1,200,000 – 1,000,000) = $1,570 $630 + 0.47 cents for each $1 in excess of $1,000,000 $1,000,000 – $2,200,000 Source: http://www.finance.wa.gov.au/cms/content.aspx?id=239
Land tax House Price & rent ($) S1 • Increase in taxes on housing suppliers shifts the supply curve to the left • Quantity of housing supplied falls from Q0 to Q1 • Price of housing supplied rises from P0 to P1 • Adverse impact on affordability S P1 P0 D Q0 Q1 Quantity of housing
NRAS • Introduced in 2008 to provide incentives to investors to build 50,000 affordable rental properties by 2012 • NRAS dwellings must be: • New or substantially renovated dwelling • Rented to eligible low & moderate income households for at least 20% below market rates for 10 years • Federal & State tax-transfer package • Tax credits last for 10 years per dwelling
NRAS House price & rents ($) S • Supply-side policy – targets rental investors • Shifts supply curve out S1 P0 P1 D Q0 Q1 Quantity of housing
NRAS • Lack of institutional investment by companies and superannuation funds • Superannuation funds cannot debt finance investments – cannot take advantage of tax shelter benefits associated with negative gearing • Deterred by land tax arrangements whereby tax rate is determined by cumulative value of land • Barriers to supply of rental housing by institutions
Income Tax on Homeowners • No deduction for expenses in relation to their own home as it is a private asset • Exempt from Capital Gains Tax (CGT) on sale of their primary residence
Stamp duty WA 2011-12 stamp duty rates • Stamp duties on conveyance – a transaction cost that is payable upfront • If purchase price is $100,000, stamp duty = 1.90% x $100,000 = $1,900 • If purchase price is $420,000, stamp duty = $11,115 + (4.75% x $420,000 - $360,000) = $11,115 + $2,850 = $13,965 $0 - $120,000 1.90% $360,000 – $725,000 $11,115 + 4.75% on amount over $360,000 http://www.finance.wa.gov.au/cms/content.aspx?id=2071
Stamp duty • Creates housing affordability problems by deterring access to home ownership • Concessions : • First home buyers whose home purchases are below $500,000 are exempt from stamp duty • Concessional rates apply for principal place of residence valued at < $200,000
Stamp duty • Impede access to home ownership – lump sum upfront cost • No strong efficiency rationale • Does not achieve a redistribution goal • Those who move more frequently pay relatively high amounts of duty: • Slows the adjustment of labour and housing markets to price signals • Deters trading down
Stamp duty No constraint 11% Repayment constrained 10% Downpayment & repayment constrained 52% Downpayment constrained 27% Source: Population estimates reported in Table 15 of Wood and Ong (2008) http://www.ahuri.edu.au/publications/p30396/
Stamp duty Price $ Supply curve P1+ Tax Tax P0 P1 Tax Demand curve before tax Demand curve after tax Q1 Q0 Number of properties
First Home Saver Account (FSHA) • To assist first home buyers to save up to purchase a home • Eligible recipients are: • Aged 18-65 years • First home buyers and • First time FHSA holders
FHSA • Federal government contribution of 17% on the first $5,000 of personal contributions made to the account in every year • Suppose a FHSA holder makes a contribution of $5,000 • Federal transfer = 17% x $5,000 = $850 • Federal government transfer is tax exempt • Interest earned on a FHSA is taxed at 15% only
Summary • Plethora of housing taxes or tax rebates • Some work to promote housing affordability e.g. NRAS, but hindered by other taxes such as land tax • Potential for reforms highlighted in the Henry Review, but not implemented by government
References • Australian Tax Office (2007), Australian Tax Statistics 2006-07 • Department of Finance (2012), Land Tax Rates, http://www.finance.wa.gov.au/cms/content.aspx?id=239 • Eslake, S. (2011), ‘Time to Axe Negative Gearing’, The Age, 25 April, http://www.theage.com.au/business/time-to-axe-negative-gearing-20110424-1dsxs.html#ixzz1cicQLPLg • Ham, S. (2009), NRAS Presentation for National Affordable Housing Summit Group Forums • Wood, G. and Ong, R. (2008), Redesigning AHURI’s Australian Housing Market Microsimulation Model, Report, November, Australian Housing and Urban Research Institute, Melbourne. • Wood, G. and Ong, R. (2010), Factors Shaping the Decision to Become A Landlord and Retain Rental Investments, Final Report No. 142, Australian Housing and Urban Research Institute, Melbourne.