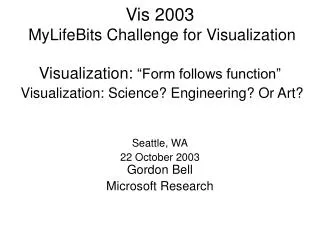
Building Remote Interactive Visualization Services: A Comprehensive Toolkit
This toolkit, developed by experts from Carnegie Mellon University, aims to facilitate the interactive visualization of large datasets, particularly focusing on earthquake simulations and related geophysical data. With the evolution of hardware and software, traditional visualization methods have become inefficient. This framework enables users to interactively visualize massive datasets while collaborating globally. It discusses challenges in grid computing, including resource allocation and performance portability, while offering strategies for efficient remote visualization, catering to both scientific and engineering applications.

Building Remote Interactive Visualization Services: A Comprehensive Toolkit
E N D
Presentation Transcript
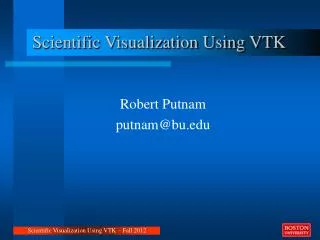
Dv: A toolkit for building remote interactive visualization services David O’Hallaron School of Computer Science and Department of Electrical and Computer Engineering Carnegie Mellon University July, 1999 Martin Aeschlimann, Julio Lopez Peter Dinda, Bruce Lowekamp www.cs.cmu.edu/~droh
Jacobo Bielak and Omar Ghattas (CMU CE) David O’Hallaron (CMU CS and ECE) Jonathan Shewchuk (UC-Berkeley) Steven Day (SDSU Geology) www.cs.cmu.edu/~quake
Teora, Italy 1980
lat. 34.38 long. -118.16 epicenter lat. 34.32 long. -118.48 x San Fernando Valley lat. 34.08 long. -118.75 San Fernando Valley
San Fernando Valley (top view) Hard rock epicenter x Soft soil
San Fernando Valley (side view) Soft soil Hard rock
Partitioned unstructured finite element mesh of San Fernando nodes element
Communication graph Vertices: processors Edges: communications
Triangle/Pyramid Author Runtime library Slice C compiler Parcel Archimedes www.cs.cmu.edu/~quake MVPRODUCT(A,x,w); Problem Finite element DOTPRODUCT(x,w,xw); Geometry (.poly) algorithm (.arch) r = r/xw; .c .node, .ele a.out .part parallel system .pack
Visualization of 1994 Northridge aftershock:Shock wave propagation path Generated by Greg Foss, Pittsburgh Supercomputing Center
Visualization of 1994 Northridge aftershock:Behavior of waves within basin Generated by Greg Foss, Pittsburgh Supercomputing Center
Animations of 1994 Northridge aftershock and 1995 Kobe mainshock • Data produced by the Quake group at Carnegie Mellon University • Images rendered by Greg Foss, Pittsburgh Supercomputing Center.
Motivation for Dv • Quake datasets are too large to store and manipulate locally. • 40 GB - 6 TB depending on degree of downsampling • Common problem now because of advances in hardware, software, and simulation methodology. • Current visualization approach • Make request to supercomputing center (PSC) graphics department. • Receive an MPEGs, JPEG and/or videotapes in a couple of weeks/months. • Desired visualization approach • Provide a remote visualization service that will allow us to visualize Quake datasets interactively and in collaboration with colleagues around the world. • Useful for qualitative debugging, demos, and solid engineering results
Internet service models request • Traditional lightweight service model • Small to moderate amount of computation to satisfy requests • e.g., serving web pages, stock quotes, online trading, current search engines • Proposed heavyweight service model • Massive amount of computation to satisfy requests • e.g., scientific visualization, data mining, future search engines • Approach: provide heavyweight services on a computational grid of hosts. server client response
Heavyweight grid service model Best effort Internet Local compute hosts (allocated once per session by the service user) Remote compute hosts (allocated once per service by the service provider)
Challenges to providing heavyweight Internet services on a computational grid • Grid resources are limited • We must find an easy way to grid-enable existing packages. • Grid resources are heterogeneous • Programs should be performance-portable (at load time) in the presence of heterogeneous resources. • Grid resources are dynamic • Programs should be performance-portable (at run time) in the face of dynamic resources. • Applications that provide heavyweight grid services must be resource-aware.
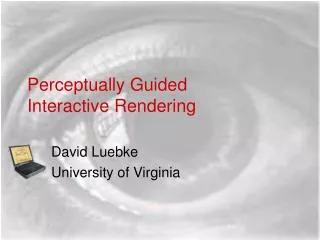
Motivating application: Earthquake ground motion visualization local display and input FEM solver engine materials database resolution contours ROI scene remote database interpolation isosurface extraction scene synthesis reading rendering vtk routines Decreasing amount of data
Approaches for providing remote viz services • Do everything on the remote server • Pros: very simple to grid enable existing packages • Cons: high latency, eliminates possibility of proxying and caching at local site, can overuse remote site, not appropriate for smaller datasets. Moderate Bandwidth Link Very high-end remote server Local machine
Approaches for providing remote viz services • Do everything but the rendering on the remote server • Pros: fairly simply to grid-enable existing packages, removes some load from the remote site. • Cons: requires every local site to have good rendering power. Moderate bandwidth Link high-end remote server Machine with good rendering power
Approaches for providing remote viz services • Use a local proxy for the rendering • Pros: offloads work from the remote site, allows local sites to contribute additional resources. • Cons: local sites may not have sufficiently powerful proxy resources, application is more complex, requires high bandwidth between local and remote sites. Moderate bandwidth link High bandwidth link powerful local proxy server high-end remote server low-end local PC or PDA
Approaches for providing remote viz services • Do everything at the local site. • Pros: low latency, easy to grid-enable existing packages. • Cons: requires high-bandwidth link between sites, requires powerful compute and graphics resources at the local site. Ultrahigh Bandwidth Link powerful local server low-end remote server
Providing remote viz services • Claim: static application partitions are not appropriate for heavyweight Internet services on computational grids • Thus, the goal with Dv is to find some flexible framework that allows us to schedule and partition heavyweight services. • The approach is based on the notion of an active frame.
Active frames Active Frame Server Input Active Frame Output Active Frame Active frame interpreter Frame data Frame program Frame data Frame program Application libraries e.g, vtk Host
Overview of a Dv visualization service User inputs/ Display Remote datasets Local Dv client Request frames Response frames Dv Server Dv Server Dv Server Dv Server ... Response frames Response frames Response frames Remote DV Active Frame Servers Local DV Active Frame Servers
Grid-enabling vtk with Dv request frame [request server, scheduler, flowgraph, data reader ] local Dv client result request server local Dv server ... ... reader scheduler response frames (to other Dv servers) [appl. data, scheduler, flowgraph,control ] local machine (Dv client) remote machine
Scheduling Dv programs • Scheduling at request frame creation time • all response frames use same schedule • can be performance portable at load time • can not be performance portable at run time • Scheduling at response frame creation time • performance portable at load time and partially at run time. • Scheduling at response frame delivery time • can be performance portable at both load and run time. • per-frame scheduling overhead a potential disadvantage.
Current Dv Issues • Flowgraphs with multiple inputs/outputs • currently only support chains • Caching • Static data such as meshes needs to be cached on intermediate servers. • Scheduling interface • Must support a wide range of scheduling strategies, from completely static (once per session) to completely dynamic (each time a frame is sent by each frame server) • Network and host resource monitoring • network queries and topology discovery (Lowekamp, O’Hallaron, Gross, HPDC99) • host load prediction (Dinda and O’Hallaron, HPDC99)
Issues (cont) • Managing the Dv grid • Resource discovery • where are the Dv servers? • which of them are running? • Resource allocation • which Dv servers are available to use? • Collective operations • Broadcast? • Global synchronization of servers • Client model • one generic client that runs in a browser • config files that personalize client interface for each new service (dataset)
Related work • Active messages (Berkeley) • Active networks (MIT) • Globus (Argonne and USC) • Legion (UVA) • Harness (ORNL) • Cumulvs (ORNL) • PVM and MPI (MSU, ORNL, Argonne)
Conclusions • Heavyweight Internet services on computational grids are emerging. • Static partitioning is not appropriate for heavyweight grid services • Actives frames provides a uniform framework for grid-enabling and partitioning heavyweight services such as remote visualization. • Dv is a toolkit based on active frames that we have used to grid-enable vtk. • Dv provides a flexible framework for experimenting with grid scheduling techniques.