Download
1 / 39
390 likes | 526 Views
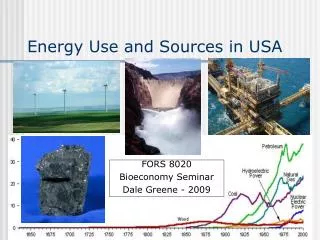
Energy Use and Sources in USA. FORS 8020 Bioeconomy Seminar Dale Greene - 2009. Energy Uses. In our economy today, we consume energy in three basis ways: To produce electricity As liquid fuels to power our vehicles To produce heat for home or industrial processes (heat & steam)

E N D
Energy Use and Sources in USA FORS 8020 Bioeconomy Seminar Dale Greene - 2009
Energy Uses In our economy today, we consume energy in three basis ways: • To produce electricity • As liquid fuels to power our vehicles • To produce heat for home or industrial processes (heat & steam) • We also use petroleum and natural gas as raw material feedstocks for chemicals, fertilizer, and plastics.
Energy Sources & Consumption • 2004 US energy consumption, quadrillion BTUs • Source vs Use • Electricity – Coal, gas, nuclear • Transportation – oil • Renewables – electricity and industry
US Electricity Sources • Base Load Plants – supply power at all times, amount varies relatively little. • Coal, Nuclear • Peak Load Plants – supply power as needed to grid. May not run at all. • Natural Gas, Hydro
Transportation Fuels • 96% is oil based (most gasoline and diesel, some natural gas and LP). • Remainder is a mix of ethanol, bio-diesel, or other fuels (growing). • Consumer fuel market is competitive, consumer self-serve, and designed for consumer convenience. • Designed around gasoline usage.
OPEC Share of World Crude Source: OPEC
OPEC Share of World Crude Source: OPEC
Top Oil Consumers • United States – 20.7 • China – 6.4 • Japan – 5.4 Millions of barrels per day, 2004. Source: Energy Information Agency
Hubbert’s Peak • Oil supplies are limited. • Many think our production has already peaked. • Prices will stay high and perhaps increase further – spurring more exploration or substitutes. M. King Hubbert, a geophysicist suggested the above trendline in 1956.
Natural Gas • Primarily methane – CH4 (70-90%) • Easily pipelined, widely used. • Most peak load electric plants built in recent years use natural gas. • Cleanest burning fossil fuel.
Natural Gas Sources Units are M cubic feet
Natural Gas • Much more abundant than petroleum, but supply is finite. • Difficult to import or export unless in liquified natural gas (LNG) form. • An important transition fuel between reliance on fossil fuels and renewables.
Nuclear Power • Base-load electricity generation. • CO2 neutral – no emissions. • Use nuclear fission – uranium-235. • Breeder reactors turn uranium-238 into plutonium-239 – potential abundant source of energy. • Clean, safe energy. • So why aren’t we using it more?
Nuclear Power • Fear. • The movie China Syndrome was popular in 1979 when the Three Mile Island incident occurred. • US construction of nuclear plants was stopped cold by public opinion. • The Washington Public Power Supply scandal further hardened public opinion. • Then Chernobyl occurred in 1986.
Nuclear Power • 104 units in the US. • No new ones in over 25 years. • All increase in electricity based on fossil fuels instead CO2 • Widely used in Europe and Asia. • Probably has to be a part of any energy landscape that reduces carbon emissions. • Disposal of radioactive waste is a key issue and one that we have delayed acting upon as a country.
Summary • Fossil fuels have finite supplies. • Oil is particularly in short supply. • Natural gas is more abundant. • Coal is plentiful. • All of these contribute to carbon loading in the atmosphere. • Nuclear is not popular.
Key Issue • Can the US use biomass to replace 30% of petroleum consumption by 2030? This translates to: • 5% of power consumption • 20% of transportation fuels • 25% of chemicals • This would represent a 5-fold increase over 2003 consumption levels of 190 million tons (forestry and agriculture combined).
Forest Biomass75% of current biomass use Primary • Logging residues from logging & land clearing • Fuel reduction treatments in high risk areas • Fuelwood extracted from forestlands Secondary • Primary processing mill wastes • Secondary processing mill wastes • Pulping liquors Tertiary • Urban wood waste – C&D, limbs, trash
Agricultural Biomass25% of current biomass use Primary • Residues from major crops – corn & grains • Grains (corn and soybeans) • Algae • Perennial grasses • Perennial woody crops (ag or forestry?) Secondary • Animal manures • Food/feed processing residues Tertiary • Municipal solid waste (MSW), post-consumer residues, and landfill gases
Potential Annual Biomass from Forests (368 million tons) • Assumptions: • Unroaded areas were excluded. • Environmentally sensitive areas were excluded. • Equipment recovery limitations considered. • Two types – (1) conventional forest products and (2) biomass for bioenergy/bioproducts. • 1.6x increase from 143 MM tons used in 2003.
Potentially Available Forest Biomass Source: EIA 2004.
Potential from Agriculture(3 scenarios) • Scenario 1 – Baseline – 194 million tons available • 20% of this is captured today. • Scenario 2 – Realistic? – 423-597 million tons available • Corn yields increase 25-50% • Planted acreage projected for 2014 (no land use change) • No soybean residues • Collect 60-75% of crop residues • 50% of biomass produced on CRP lands is available (???) • 75 million dry tons of manure • Crop residues account for 65-75% of total biomass
Potential from Agriculture(3 scenarios) • Scenario 3 – Aggressive? – 581-998 million tons available • Scenario 2 plus…. • Soybeans yield a third more biomass and it is captured. • Up to 60 million acres converted to perennial crops • Short rotation woody crops increase from 0.1 to 5.0 million acres with 25% used for bioproducts and remainder for forest products - ? • Other 55 million acres is perennial grass, 90% used for bioproducts • Crop residues account for 50%, perennial crops for 30-40% of total biomass • With current market prices, farmers are not taking CRP lands out of the program to plant them in row crops again.
Potentially Available Agricultural BiomassPerennial Crops Assume Major CRP Land Use Change
Potential Annual Biomass from Agriculture (998 million tons) • Assumptions: • Crop yields increased 50%. • Soybean residue:grain ratio increased to 2:1. • 75% of residues can be harvested. • Cropland managed with no-till methods. • 55 million acres dedicated to bioenergy crops. • All manure in excess of allowable soil amendment levels used for bioenergy. • 21x increase from 48 MM tons used in 2003. • 5x increase from amount available in 2003.
Summary • The potential for using substantially more biomass is there on a sustainable level. • Forestry projections without fuel treatments gives ~310 million tons – 2x today’s level of usage. • Agricultural projections of 400-600 million tons may be achievable – 8-12x today’s level of usage. • Sustained higher prices for competing fossil fuel feedstocks will be critical to capturing a significant amount of this potential.
Energy Independence in Brazil:Lessons for the United States • Significant expansion of domestic oil production • State-owned oil company required to sell ethanol at subsidized prices • 20% ethanol mix mandate • Flex fuel vehicles = 73% of new cars sold today • 48% of fuel used by gasoline cars is ethanol • Diesel is more popular • Scale differences (chart)
The New Petroleum • 1999 – Senator Lugar and former CIA Director Woolsey • Energy security = national security • Urge switch to cellulosic fuels to reduce reliance on OPEC • Big share (1/3) of US trade deficit is for oil purchases • Requires modest changes to vehicles and infrastructure • Widespread availability of flex-fuel vehicles also needed • Compares current technology to oil refining in 1900 • Ethanol – 69% energy content, 115% octane rating, lower vapor pressure when 22%+ mix • Urge Federal R&D spending, tax code incentives for cellulosic ethanol & FFVs, govt-industry partnership